See more : Tenfu (Cayman) Holdings Company Limited (6868.HK) Income Statement Analysis – Financial Results
Complete financial analysis of American Water Works Company, Inc. (AWK) income statement, including revenue, profit margins, EPS and key performance metrics. Get detailed insights into the financial performance of American Water Works Company, Inc., a leading company in the Regulated Water industry within the Utilities sector.
- CareTrust REIT, Inc. (CTRE) Income Statement Analysis – Financial Results
- Population Health Investment Co., Inc. (PHICU) Income Statement Analysis – Financial Results
- BOOKOOK Securities Co., Ltd. (001275.KS) Income Statement Analysis – Financial Results
- Zhejiang Reclaim Construction Group Co., Ltd. (002586.SZ) Income Statement Analysis – Financial Results
- Vår Energi AS (VAR.OL) Income Statement Analysis – Financial Results
American Water Works Company, Inc. (AWK)
About American Water Works Company, Inc.
American Water Works Company, Inc., through its subsidiaries, provides water and wastewater services in the United States. It offers water and wastewater services to approximately 1,700 communities in 14 states serving approximately 3.4 million active customers. The company serves residential customers; commercial customers, including food and beverage providers, commercial property developers and proprietors, and energy suppliers; fire service and private fire customers; industrial customers, such as large-scale manufacturers, mining, and production operations; public authorities comprising government buildings and other public sector facilities, such as schools and universities; and other utilities and community water and wastewater systems. It also provides water and wastewater services on various military installations; and undertakes contracts with municipal customers, primarily to operate and manage water and wastewater facilities, as well as offers other related services. In addition, the company operates approximately 80 surface water treatment plants; 480 groundwater treatment plants; 160 wastewater treatment plants; 52,500 miles of transmission, distribution, and collection mains and pipes; 1,100 groundwater wells; 1,700 water and wastewater pumping stations; 1,300 treated water storage facilities; and 76 dams. It serves approximately 14 million people with drinking water, wastewater, and other related services in 24 states. American Water Works Company, Inc. was founded in 1886 and is headquartered in Camden, New Jersey.
| Metric | 2023 | 2022 | 2021 | 2020 | 2019 | 2018 | 2017 | 2016 | 2015 | 2014 | 2013 | 2012 | 2011 | 2010 | 2009 | 2008 | 2007 | 2006 | 2005 | 2001 | 2000 | 1999 | 1998 | 1997 | 1996 | 1995 | 1994 | 1993 | 1992 | 1991 | 1990 | 1989 | 1988 | 1987 | 1986 | 1985 |
|---|---|---|---|---|---|---|---|---|---|---|---|---|---|---|---|---|---|---|---|---|---|---|---|---|---|---|---|---|---|---|---|---|---|---|---|---|
| Revenue | 4.23B | 3.79B | 3.93B | 3.78B | 3.61B | 3.44B | 3.36B | 3.30B | 3.16B | 3.01B | 2.90B | 2.88B | 2.67B | 2.71B | 2.44B | 2.34B | 2.21B | 2.09B | 2.14B | 1.44B | 1.35B | 1.26B | 1.02B | 954.20M | 894.60M | 802.80M | 770.20M | 717.50M | 657.40M | 633.00M | 570.70M | 527.50M | 511.90M | 483.40M | 466.50M | 429.70M |
| Cost of Revenue | 1.72B | 1.59B | 1.78B | 1.62B | 1.54B | 1.48B | 1.38B | 1.50B | 1.40B | 1.35B | 1.31B | 1.35B | 1.30B | 1.39B | 1.32B | 1.30B | 0.00 | 0.00 | 0.00 | 664.55M | 592.63M | 552.96M | 437.10M | 421.60M | 418.20M | 396.70M | 385.00M | 355.80M | 333.20M | 318.30M | 294.70M | 285.60M | 271.60M | 246.50M | 232.70M | 213.00M |
| Gross Profit | 2.51B | 2.20B | 2.15B | 2.16B | 2.07B | 1.96B | 1.98B | 1.80B | 1.76B | 1.66B | 1.59B | 1.53B | 1.36B | 1.32B | 1.12B | 1.03B | 2.21B | 2.09B | 2.14B | 774.34M | 757.96M | 707.89M | 580.70M | 532.60M | 476.40M | 406.10M | 385.20M | 361.70M | 324.20M | 314.70M | 276.00M | 241.90M | 240.30M | 236.90M | 233.80M | 216.70M |
| Gross Profit Ratio | 59.38% | 58.10% | 54.78% | 57.06% | 57.23% | 57.01% | 58.95% | 54.45% | 55.56% | 55.17% | 54.76% | 53.07% | 51.17% | 48.75% | 45.74% | 44.21% | 100.00% | 100.00% | 100.00% | 53.82% | 56.12% | 56.14% | 57.05% | 55.82% | 53.25% | 50.59% | 50.01% | 50.41% | 49.32% | 49.72% | 48.36% | 45.86% | 46.94% | 49.01% | 50.12% | 50.43% |
| Research & Development | 0.00 | 0.00 | 0.00 | 0.00 | 0.00 | 0.00 | 0.00 | 0.00 | 5.00M | 3.00M | 3.00M | 2.80M | 0.00 | 0.00 | 0.00 | 0.00 | 0.00 | 0.00 | 0.00 | 0.00 | 0.00 | 0.00 | 0.00 | 0.00 | 0.00 | 0.00 | 0.00 | 0.00 | 0.00 | 0.00 | 0.00 | 0.00 | 0.00 | 0.00 | 0.00 | 0.00 |
| General & Administrative | 0.00 | 0.00 | 0.00 | 0.00 | 0.00 | 0.00 | 0.00 | 0.00 | 0.00 | 0.00 | 0.00 | 0.00 | 0.00 | 0.00 | 0.00 | 0.00 | 0.00 | 0.00 | 0.00 | 0.00 | 0.00 | 0.00 | 0.00 | 0.00 | 0.00 | 0.00 | 0.00 | 0.00 | 0.00 | 0.00 | 0.00 | 0.00 | 0.00 | 0.00 | 0.00 | 0.00 |
| Selling & Marketing | 0.00 | 0.00 | 0.00 | 0.00 | 0.00 | 0.00 | 0.00 | 0.00 | 0.00 | 0.00 | 0.00 | 0.00 | 0.00 | 0.00 | 0.00 | 0.00 | 0.00 | 0.00 | 0.00 | 0.00 | 0.00 | 0.00 | 0.00 | 0.00 | 0.00 | 0.00 | 0.00 | 0.00 | 0.00 | 0.00 | 0.00 | 0.00 | 0.00 | 0.00 | 0.00 | 0.00 |
| SG&A | 32.00M | 77.00M | 78.00M | 49.00M | 16.00M | 20.00M | 9.00M | 5.00M | 14.00M | 15.00M | 16.00M | 16.94M | 0.00 | 0.00 | 0.00 | 0.00 | 0.00 | -5.98M | 0.00 | 0.00 | 0.00 | 0.00 | 0.00 | 0.00 | 0.00 | 0.00 | 0.00 | 0.00 | 0.00 | 0.00 | 0.00 | 0.00 | 0.00 | 0.00 | 0.00 | 5.40M |
| Other Expenses | 978.00M | 930.00M | 957.00M | 907.00M | 862.00M | 39.00M | 17.00M | 15.00M | 15.00M | -3.20M | -4.05M | -926.00K | 1.86B | 1.96B | 1.82B | 2.53B | 2.21B | 1.85B | 0.00 | 982.06M | 894.41M | 841.26M | 659.70M | 622.00M | 602.10M | 559.90M | 538.70M | 498.80M | 122.00M | 110.40M | 99.10M | 86.70M | 80.30M | 77.10M | 73.10M | 68.20M |
| Operating Expenses | 1.01B | 930.00M | 957.00M | 907.00M | 862.00M | 822.00M | 751.00M | 728.00M | 683.00M | 660.82M | 642.36M | 602.72M | 1.86B | 1.96B | 1.82B | 2.53B | 2.21B | 1.84B | 0.00 | 982.06M | 894.41M | 841.26M | 659.70M | 622.00M | 602.10M | 559.90M | 538.70M | 498.80M | 122.00M | 110.40M | 99.10M | 86.70M | 80.30M | 77.10M | 73.10M | 73.60M |
| Cost & Expenses | 2.73B | 2.52B | 2.73B | 2.53B | 2.41B | 2.30B | 2.13B | 2.23B | 2.09B | 2.01B | 1.96B | 1.95B | 1.86B | 1.96B | 1.82B | 2.53B | 2.21B | 1.84B | 0.00 | 1.65B | 1.49B | 1.39B | 1.10B | 1.04B | 1.02B | 956.60M | 923.70M | 854.60M | 455.20M | 428.70M | 393.80M | 372.30M | 351.90M | 323.60M | 305.80M | 286.60M |
| Interest Income | 73.00M | 52.00M | 4.00M | 2.00M | 4.00M | 0.00 | 0.00 | 0.00 | 0.00 | 11.44M | 11.75M | 12.65M | 10.94M | 5.80M | 0.00 | 0.00 | 0.00 | 0.00 | 0.00 | 0.00 | 0.00 | 0.00 | 0.00 | 0.00 | 0.00 | 0.00 | 0.00 | 0.00 | 0.00 | 0.00 | 0.00 | 0.00 | 0.00 | 0.00 | 0.00 | 0.00 |
| Interest Expense | 460.00M | 433.00M | 403.00M | 408.00M | 399.00M | 0.00 | 0.00 | 0.00 | 0.00 | 309.26M | 319.92M | 323.45M | 323.36M | 315.04M | 296.55M | 285.16M | 0.00 | 0.00 | 0.00 | 0.00 | 0.00 | 0.00 | 0.00 | 0.00 | 0.00 | 0.00 | 0.00 | 0.00 | 0.00 | 0.00 | 0.00 | 0.00 | 0.00 | 0.00 | 0.00 | 0.00 |
| Depreciation & Amortization | 704.00M | 649.00M | 636.00M | 604.00M | 582.00M | 545.00M | 492.00M | 470.00M | 440.00M | 424.08M | 407.72M | 381.50M | 351.82M | 354.65M | 335.16M | 311.44M | 265.83M | 257.88M | 0.00 | -201.20M | -176.56M | -165.63M | -129.80M | -112.50M | -101.90M | -87.00M | -80.60M | -75.10M | -58.40M | -52.10M | -47.00M | -39.70M | 35.50M | 35.00M | 32.80M | 29.60M |
| EBITDA | 2.36B | 2.00B | 1.91B | 1.90B | 1.81B | 1.70B | 1.71B | 1.62B | 1.51B | 1.43B | 1.36B | 1.33B | 1.17B | 1.11B | 520.06M | 97.88M | 307.20M | 511.77M | 2.14B | -21.28M | 40.10M | 62.40M | 30.29M | 3.13M | 395.90M | -66.80M | -73.40M | -62.00M | 257.20M | 251.50M | 220.40M | 192.00M | 195.50M | 194.80M | 193.50M | 172.70M |
| EBITDA Ratio | 55.74% | 54.61% | 49.16% | 49.03% | 50.53% | 50.15% | 50.97% | 46.34% | 47.77% | 46.74% | 47.45% | 44.54% | 42.83% | 40.68% | 39.28% | 4.84% | 11.81% | 24.70% | 100.00% | -1.48% | 3.60% | 4.95% | 5.12% | 2.52% | -2.84% | -7.44% | -9.53% | -8.54% | 39.12% | 39.73% | 38.62% | 36.40% | 37.84% | 39.41% | 40.04% | 40.03% |
| Operating Income | 1.50B | 1.27B | 1.20B | 1.25B | 1.17B | 1.10B | 1.24B | 1.08B | 1.08B | 1.00B | 945.85M | 924.97M | 803.14M | 748.09M | 173.61M | -193.17M | 2.94M | 253.51M | 2.14B | -207.72M | -136.46M | -133.37M | -79.00M | -89.40M | -125.70M | -153.80M | -153.50M | -137.10M | 202.20M | 204.30M | 176.90M | 155.20M | 160.00M | 159.80M | 160.70M | 143.10M |
| Operating Income Ratio | 35.52% | 33.57% | 30.43% | 33.04% | 32.41% | 32.03% | 37.06% | 32.71% | 34.03% | 33.29% | 32.59% | 32.15% | 30.12% | 27.60% | 7.11% | -8.27% | 0.13% | 12.11% | 100.00% | -14.44% | -10.10% | -10.58% | -7.76% | -9.37% | -14.05% | -19.16% | -19.93% | -19.11% | 30.76% | 32.27% | 31.00% | 29.42% | 31.26% | 33.06% | 34.45% | 33.30% |
| Total Other Income/Expenses | -308.00M | -265.00M | 444.00M | -324.00M | -381.00M | -315.00M | -341.00M | -315.00M | -293.00M | -293.00M | -342.53M | -293.72M | -299.46M | -298.66M | -285.27M | -263.70M | -258.46M | -356.47M | -2.14B | 479.53M | 402.82M | -189.25M | 324.99M | 315.08M | -128.50M | 303.50M | 282.10M | 260.40M | -96.30M | -92.50M | -90.20M | -80.40M | -72.10M | -62.70M | -57.50M | -59.10M |
| Income Before Tax | 1.20B | 1.01B | 1.64B | 924.00M | 833.00M | 787.00M | 912.00M | 770.00M | 782.00M | 709.81M | 605.47M | 631.26M | 503.68M | 449.44M | -111.67M | -450.59M | -255.52M | -108.94M | 0.00 | 271.81M | 266.37M | 230.35M | 214.30M | 193.80M | 165.50M | 149.70M | 128.60M | 123.30M | 105.90M | 111.80M | 86.70M | 74.80M | 87.90M | 97.10M | 103.20M | 84.00M |
| Income Before Tax Ratio | 28.25% | 26.58% | 41.73% | 24.46% | 23.07% | 22.88% | 27.17% | 23.32% | 24.75% | 23.57% | 20.86% | 21.94% | 18.89% | 16.58% | -4.58% | -19.28% | -11.54% | -5.20% | 0.00% | 18.89% | 19.72% | 18.27% | 21.06% | 20.31% | 18.50% | 18.65% | 16.70% | 17.18% | 16.11% | 17.66% | 15.19% | 14.18% | 17.17% | 20.09% | 22.12% | 19.55% |
| Income Tax Expense | 252.00M | 188.00M | 377.00M | 215.00M | 212.00M | 222.00M | 486.00M | 302.00M | 306.00M | 279.97M | 236.21M | 257.01M | 198.75M | 181.61M | 121.42M | 111.83M | 86.76M | 46.91M | 325.04M | 110.32M | 105.31M | 91.40M | 83.30M | 74.70M | 63.80M | 57.60M | 49.90M | 47.90M | 37.70M | 38.20M | 29.60M | 26.50M | 31.00M | 41.10M | 47.40M | 37.10M |
| Net Income | 944.00M | 820.00M | 1.26B | 709.00M | 621.00M | 567.00M | 426.00M | 468.00M | 476.00M | 423.11M | 369.26M | 358.07M | 309.61M | 267.83M | -233.08M | -562.42M | -342.83M | -162.24M | -325.04M | 161.48M | 161.06M | 138.95M | 131.00M | 119.10M | 101.70M | 92.10M | 78.70M | 75.40M | 68.20M | 73.60M | 57.10M | 48.30M | 56.90M | 56.00M | 55.80M | 46.90M |
| Net Income Ratio | 22.30% | 21.62% | 32.14% | 18.77% | 17.20% | 16.48% | 12.69% | 14.17% | 15.07% | 14.05% | 12.73% | 12.45% | 11.61% | 9.88% | -9.55% | -24.07% | -15.48% | -7.75% | -15.21% | 11.22% | 11.93% | 11.02% | 12.87% | 12.48% | 11.37% | 11.47% | 10.22% | 10.51% | 10.37% | 11.63% | 10.01% | 9.16% | 11.12% | 11.58% | 11.96% | 10.91% |
| EPS | 4.89 | 4.51 | 6.94 | 3.92 | 3.43 | 3.15 | 2.39 | 2.63 | 2.66 | 2.36 | 2.08 | 2.03 | 1.77 | 1.53 | -1.39 | -3.52 | -2.14 | -1.01 | -2.03 | 1.62 | 1.61 | 1.40 | 1.54 | 1.42 | 1.31 | 1.32 | 1.17 | 1.15 | 1.04 | 1.14 | 0.92 | 0.78 | 0.92 | 0.91 | 0.91 | 0.77 |
| EPS Diluted | 4.89 | 4.51 | 6.94 | 3.90 | 3.43 | 3.15 | 2.38 | 2.62 | 2.64 | 2.35 | 2.06 | 2.01 | 1.76 | 1.53 | -1.39 | -3.52 | -2.14 | -1.01 | -1.72 | 1.61 | 1.61 | 1.40 | 1.54 | 1.42 | 1.31 | 1.32 | 1.17 | 1.15 | 1.04 | 1.14 | 0.92 | 0.78 | 0.92 | 0.91 | 0.90 | 0.76 |
| Weighted Avg Shares Out | 193.00M | 182.00M | 182.00M | 181.00M | 181.00M | 180.00M | 178.00M | 178.00M | 179.00M | 178.89M | 178.00M | 176.45M | 175.48M | 174.83M | 168.16M | 159.97M | 160.00M | 160.00M | 160.12M | 99.47M | 97.99M | 96.54M | 95.23M | 94.08K | 74.58M | 66.74M | 63.85M | 62.09M | 61.73M | 61.32M | 61.30M | 61.03M | 60.98M | 60.55M | 60.33M | 59.61M |
| Weighted Avg Shares Out (Dil) | 193.00M | 182.00M | 182.00M | 182.00M | 181.00M | 180.00M | 179.00M | 179.00M | 180.00M | 179.81M | 179.00M | 177.67M | 176.53M | 175.12M | 168.16M | 159.97M | 160.00M | 160.00M | 188.98M | 99.47M | 97.99M | 96.54M | 95.23M | 94.08K | 74.58M | 66.74M | 63.85M | 62.09M | 61.73M | 61.32M | 61.30M | 61.03M | 60.98M | 60.55M | 61.00M | 60.39M |
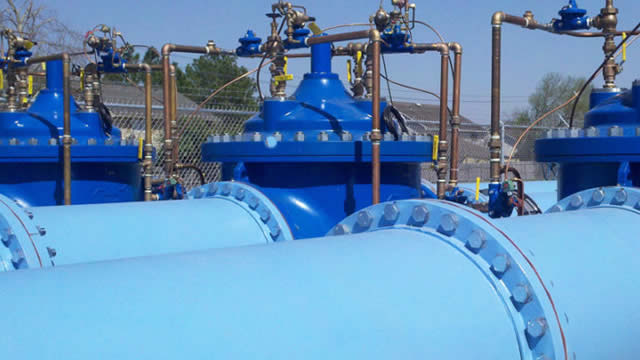
American Water, largest water utility, hit by cyberattack at time of rising threats against U.S. water supply
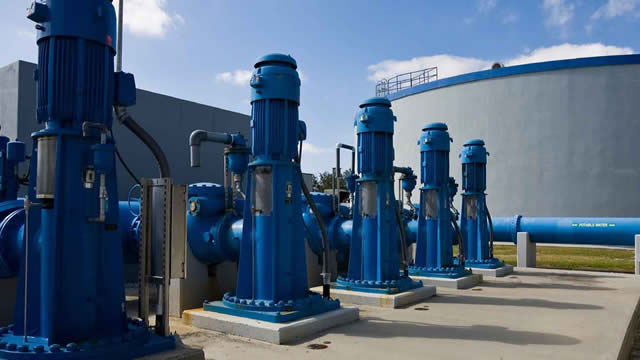
Water utility American Water disconnects computers following 'cybersecurity incident'

American Water warns of billing outages after finding hackers in its systems
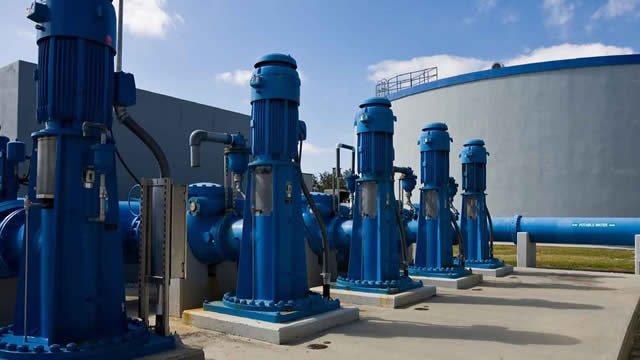
American Water Works targeted in cybersecurity incident
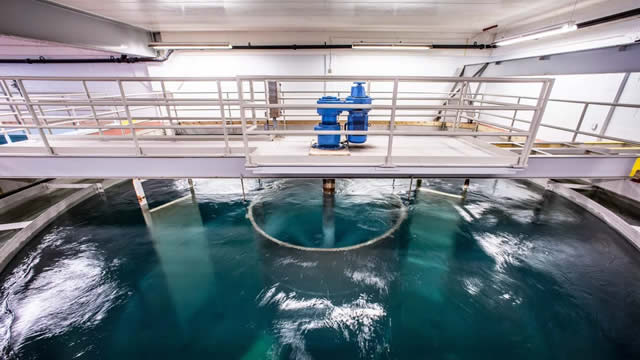
3 Top-Notch Utility Stocks to Buy in October
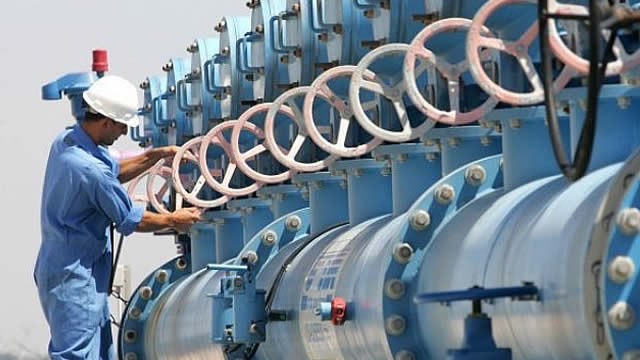
Beat the Volatility: Top 3 Low-Beta Stocks to Watch

Missouri American Water Announces Recipients of 2024 Firefighter Grant Program

Maryland American Water Receives Commission Approval for Acquisition of Severn Water Company

VEOEY vs. AWK: Which Stock Should Value Investors Buy Now?

What to Expect When AWK Release 3rd Quarter Earnings
Source: https://incomestatements.info
Category: Stock Reports
