See more : Hyatt Hotels Corporation (H) Income Statement Analysis – Financial Results
Complete financial analysis of Atreca, Inc. (BCEL) income statement, including revenue, profit margins, EPS and key performance metrics. Get detailed insights into the financial performance of Atreca, Inc., a leading company in the Biotechnology industry within the Healthcare sector.
- PT Adi Sarana Armada Tbk (ASSA.JK) Income Statement Analysis – Financial Results
- UEX Corporation (UEX.TO) Income Statement Analysis – Financial Results
- Kaset Thai International Sugar Corporation Public Company Limited (KTIS.BK) Income Statement Analysis – Financial Results
- PT Wijaya Karya Beton Tbk (WTON.JK) Income Statement Analysis – Financial Results
- Ronglian Group Ltd. (002642.SZ) Income Statement Analysis – Financial Results
Atreca, Inc. (BCEL)
About Atreca, Inc.
Atreca, Inc., a clinical-stage biopharmaceutical company, discovers and develops antibody-based immunotherapeutics to treat a range of solid tumor types. Its lead product candidate is ATRC-101, a monoclonal antibody with a novel mechanism of action and target derived from an antibody identified using its discovery platform. The company's ATRC-101 product candidate reacts in vitro with a majority of human ovarian, non-small cell lung, colorectal, and breast cancer samples from multiple patients. It also developing APN-122597, a receptor tyrosine kinase that target tumor tissues; and ATRC-501/MAM01, that targets the circumsporozoite protein of Plasmodium falciparum for the treatment of malaria. It has a collaboration and license agreement with Xencor, Inc. for research, development, and commercialization of novel CD3 bispecific antibodies in oncology; licensing agreement with the Bill & Melinda Gates Medical Research Institute for the development and commercialization of MAM01/ATRC-501 for the prevention of malaria. Atreca, Inc. was incorporated in 2010 and is based in San Carlos, California.
| Metric | 2022 | 2021 | 2020 | 2019 | 2018 | 2017 |
|---|---|---|---|---|---|---|
| Revenue | 770.00K | 851.00K | 1.35M | 2.13M | 0.00 | 0.00 |
| Cost of Revenue | 7.08M | 77.00K | 22.00K | 122.00K | 0.00 | 0.00 |
| Gross Profit | -6.31M | 774.00K | 1.33M | 2.01M | 0.00 | 0.00 |
| Gross Profit Ratio | -819.61% | 90.95% | 98.37% | 94.28% | 0.00% | 0.00% |
| Research & Development | 66.83M | 78.35M | 62.05M | 54.73M | 32.51M | 24.87M |
| General & Administrative | 31.47M | 31.95M | 26.83M | 17.85M | 7.06M | 4.56M |
| Selling & Marketing | 0.00 | 0.00 | 0.00 | 0.00 | 0.00 | 0.00 |
| SG&A | 31.47M | 31.95M | 26.83M | 17.85M | 7.06M | 4.56M |
| Other Expenses | 770.00K | 851.00K | 1.35M | 2.13M | 961.00K | 1.72M |
| Operating Expenses | 98.30M | 110.30M | 88.88M | 72.57M | 39.57M | 29.44M |
| Cost & Expenses | 98.30M | 110.30M | 88.88M | 72.57M | 39.57M | 29.44M |
| Interest Income | 817.00K | 207.00K | 1.22M | 3.21M | 714.00K | 152.00K |
| Interest Expense | 0.00 | 3.00K | 4.00K | 6.00K | 9.00K | 14.00K |
| Depreciation & Amortization | 7.08M | 4.55M | 2.38M | 1.70M | 1.41M | 1.21M |
| EBITDA | -90.44M | -104.70M | -83.93M | -67.22M | -37.20M | -26.51M |
| EBITDA Ratio | -12,559.48% | -12,837.25% | -6,203.33% | -3,150.14% | 0.00% | 0.00% |
| Operating Income | -103.79M | -113.80M | -86.31M | -68.92M | -39.57M | -29.44M |
| Operating Income Ratio | -13,479.09% | -13,371.92% | -6,379.01% | -3,229.66% | 0.00% | 0.00% |
| Total Other Income/Expenses | 368.00K | 978.00K | 1.19M | 5.09M | 1.63M | 1.91M |
| Income Before Tax | -97.16M | -109.33M | -86.33M | -67.48M | -37.94M | -27.52M |
| Income Before Tax Ratio | -12,617.79% | -12,846.65% | -6,380.93% | -3,162.28% | 0.00% | 0.00% |
| Income Tax Expense | -6.63M | 1.00K | 1.00K | 1.00K | -1.00K | 3.00K |
| Net Income | -90.53M | -109.33M | -86.34M | -67.48M | -37.94M | -27.53M |
| Net Income Ratio | -11,756.49% | -12,846.77% | -6,381.01% | -3,162.32% | 0.00% | 0.00% |
| EPS | -2.35 | -2.95 | -2.70 | -4.26 | -11.75 | -12.44 |
| EPS Diluted | -2.35 | -2.95 | -2.70 | -4.26 | -11.75 | -12.44 |
| Weighted Avg Shares Out | 38.59M | 37.04M | 31.92M | 15.83M | 3.23M | 2.21M |
| Weighted Avg Shares Out (Dil) | 38.59M | 37.04M | 31.92M | 15.83M | 3.23M | 2.21M |
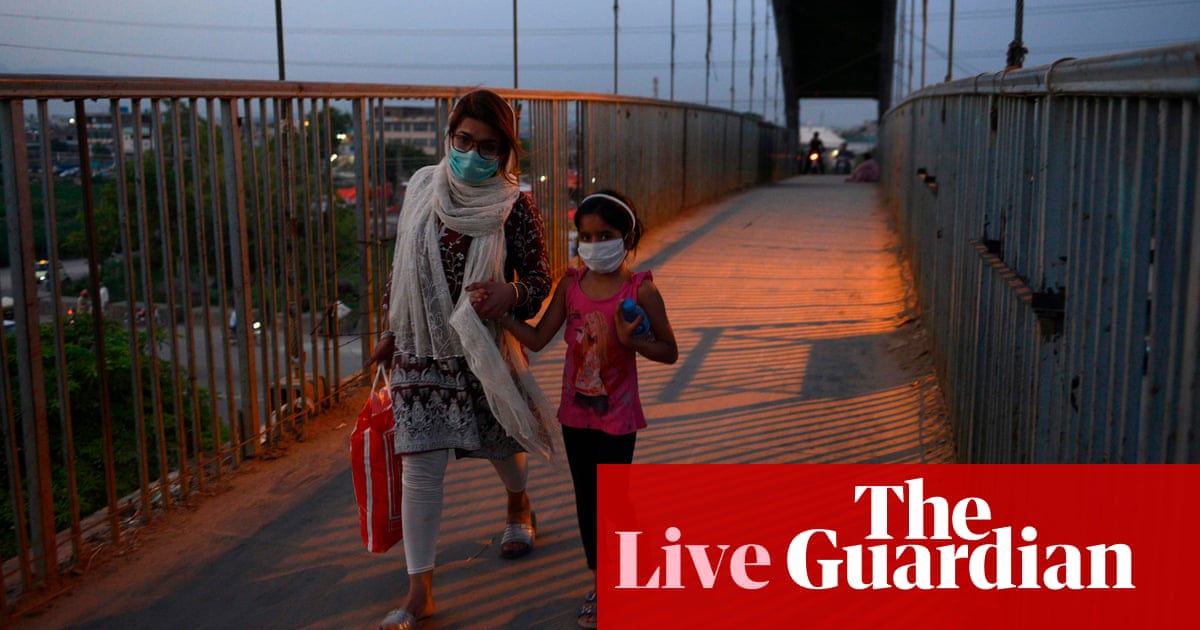
Coronavirus live news: WHO urges Pakistan to reimpose lockdown as Brazil restores Covid-19 data
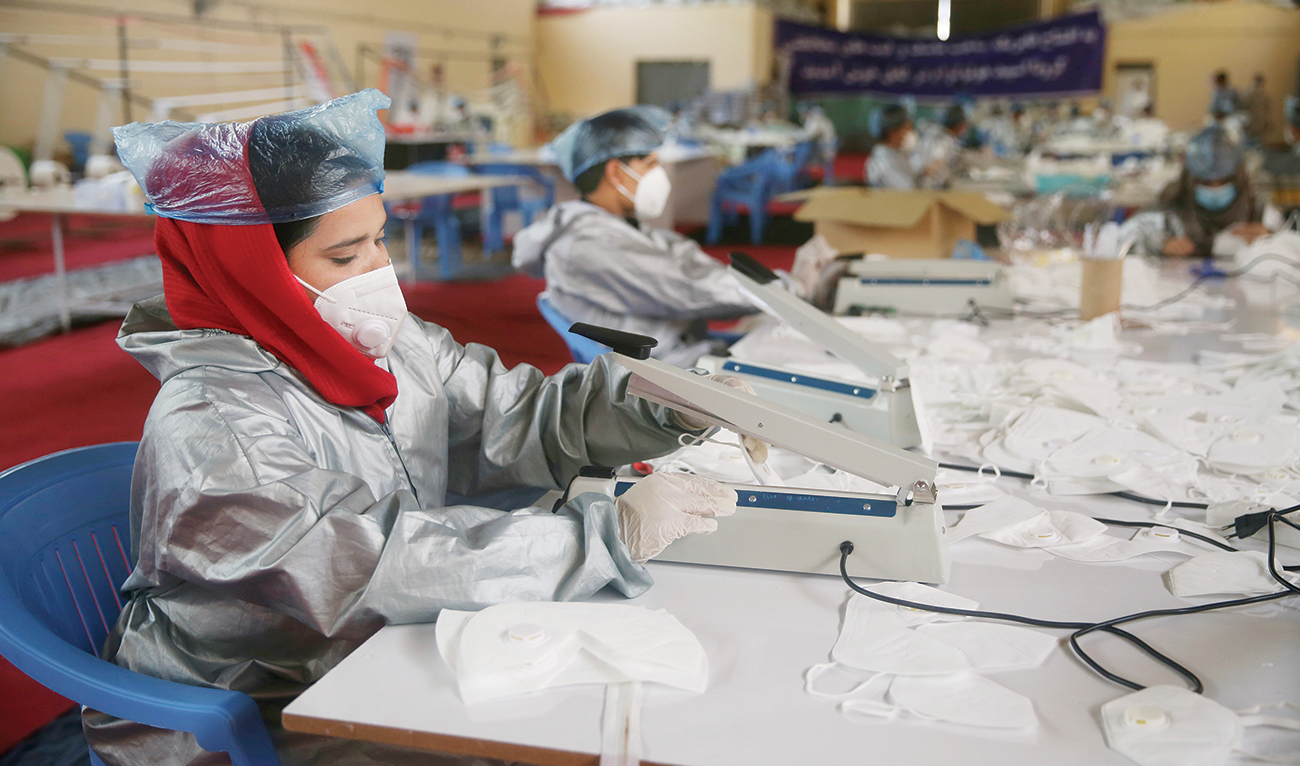
Afghanistan races against time to contain outbreak

Afghan cricket team starts training despite virus fears

EU plea: Bloc urged to resolve horror housing row as Greece crisis deepens

Five million people in East Africa at risk of hunger from 'worst locust invasion in a generation'

Group: Lack of virus tests pushes Afghanistan toward crisis

Group: Lack of virus tests pushes Afghanistan toward crisis
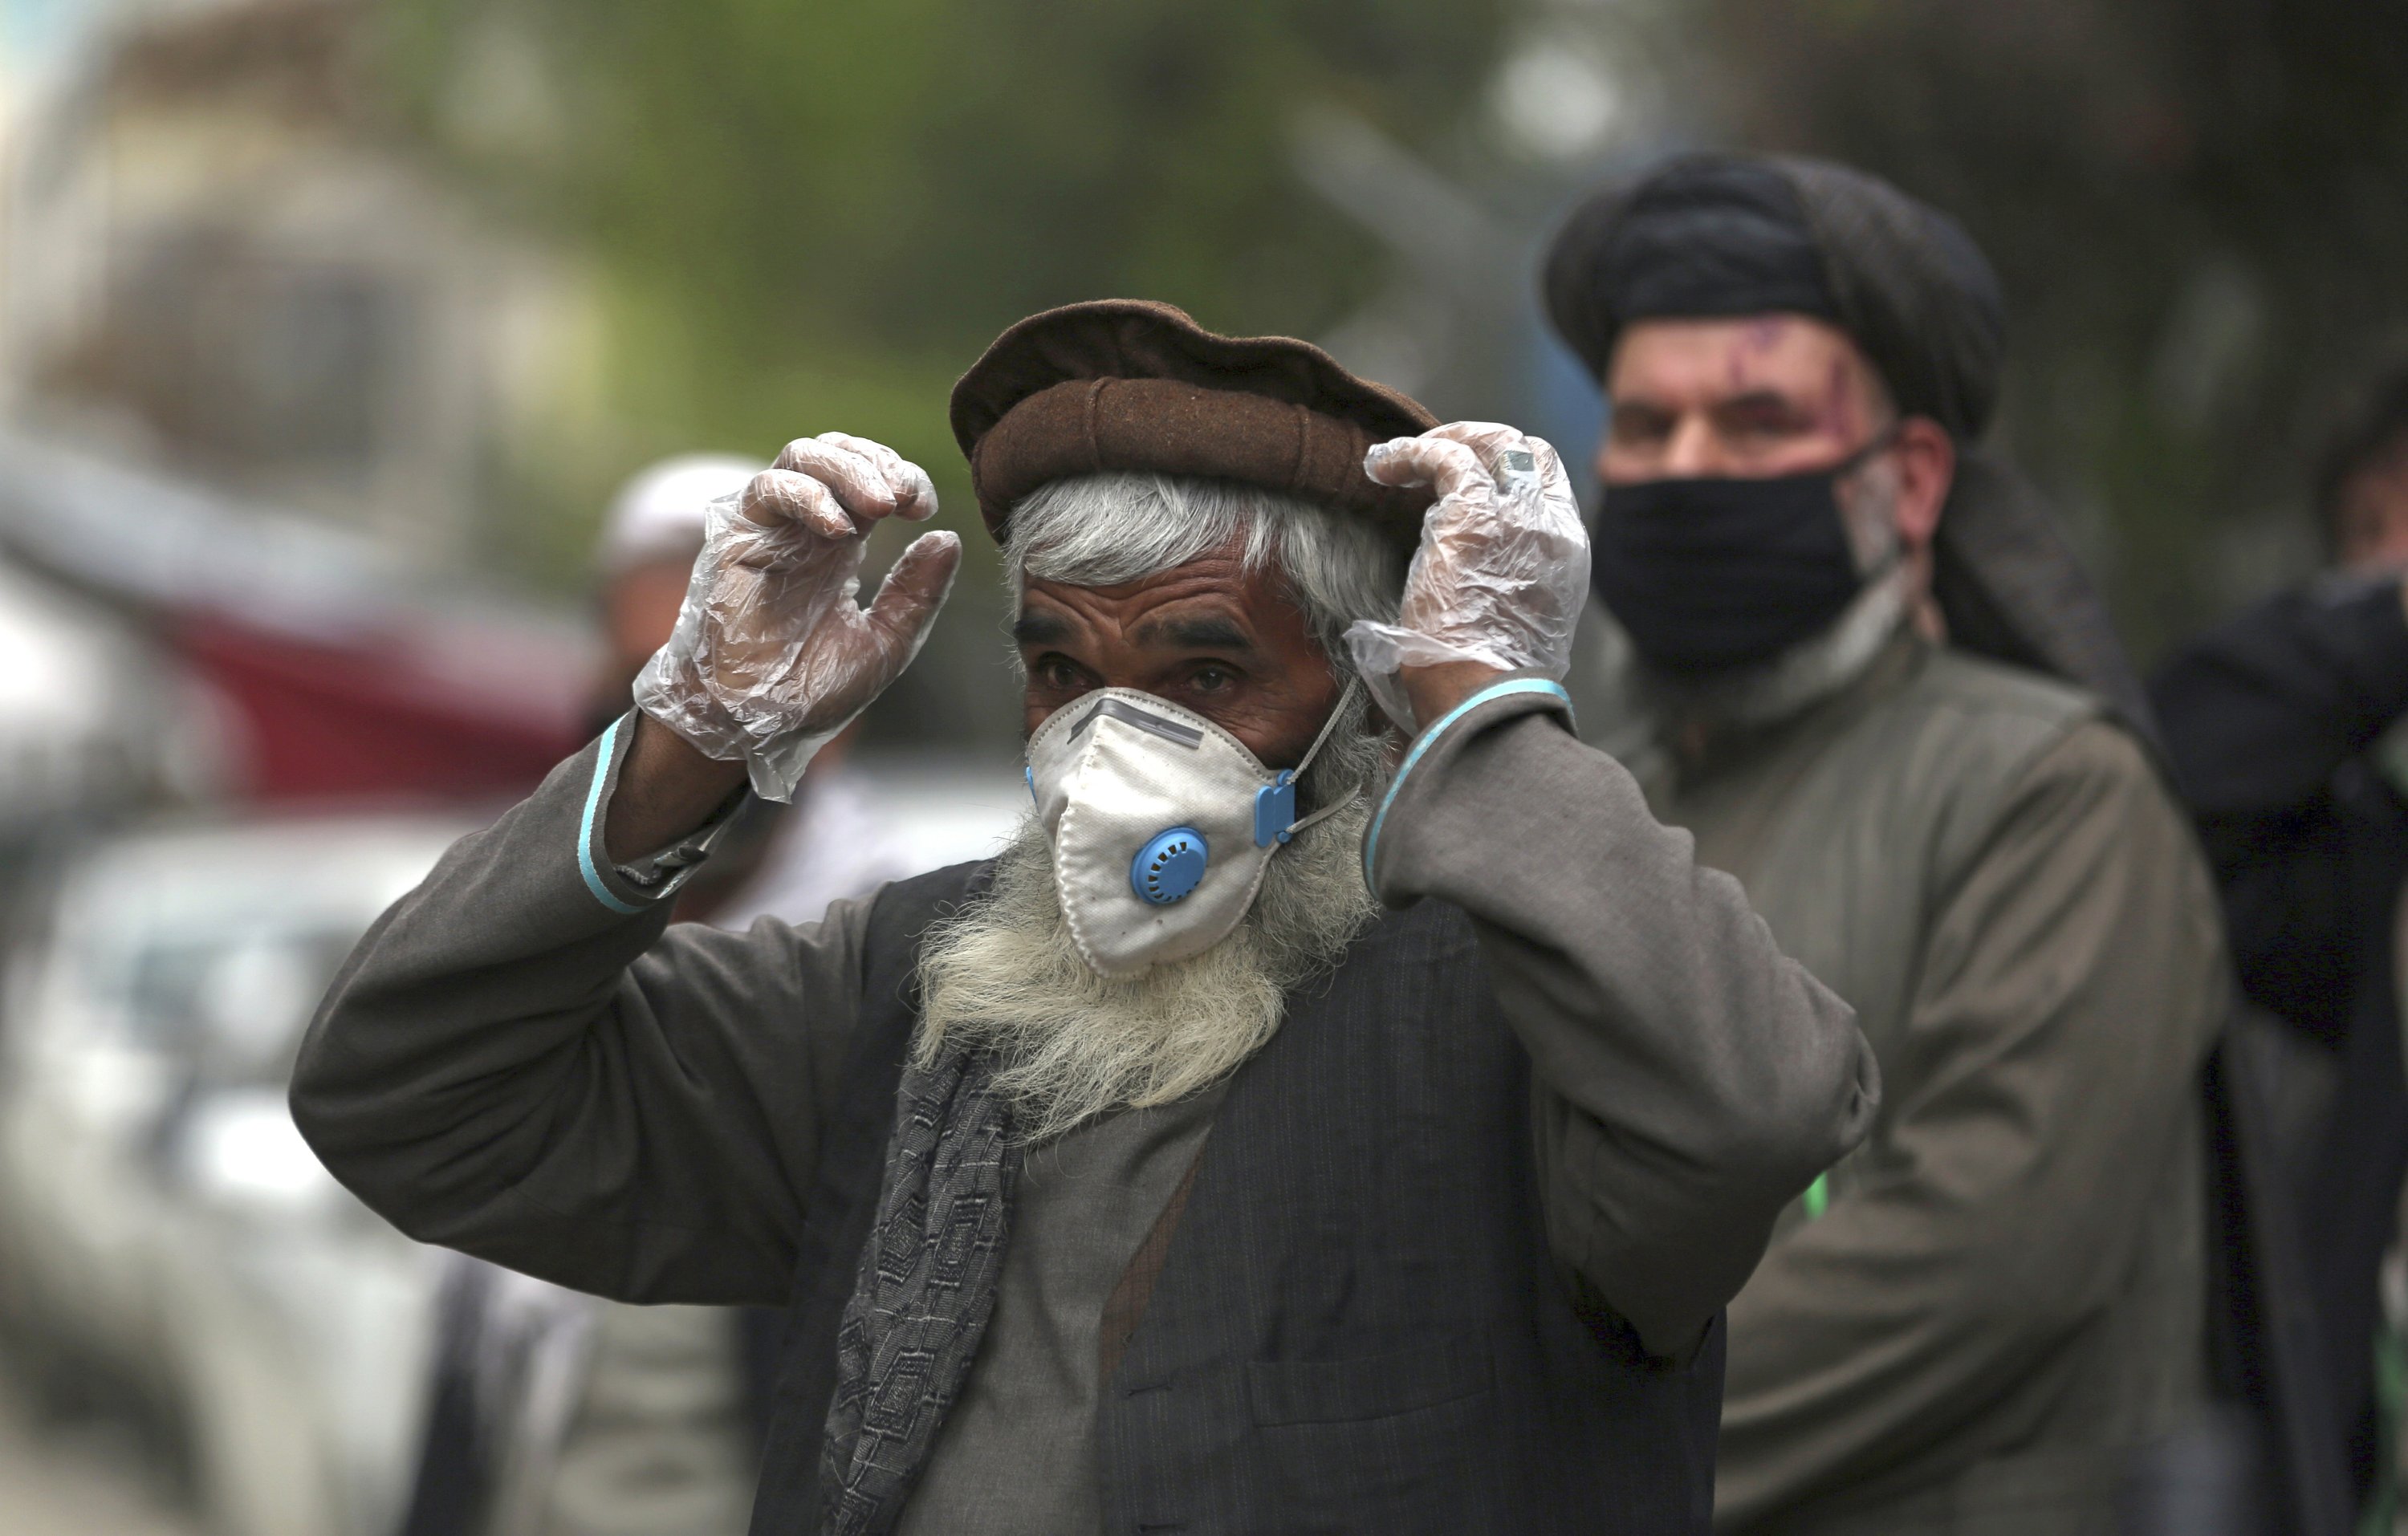
Group: Lack of virus tests pushes Afghanistan toward crisis

South Sudan must end political standoff to respond to COVID-19: IRC
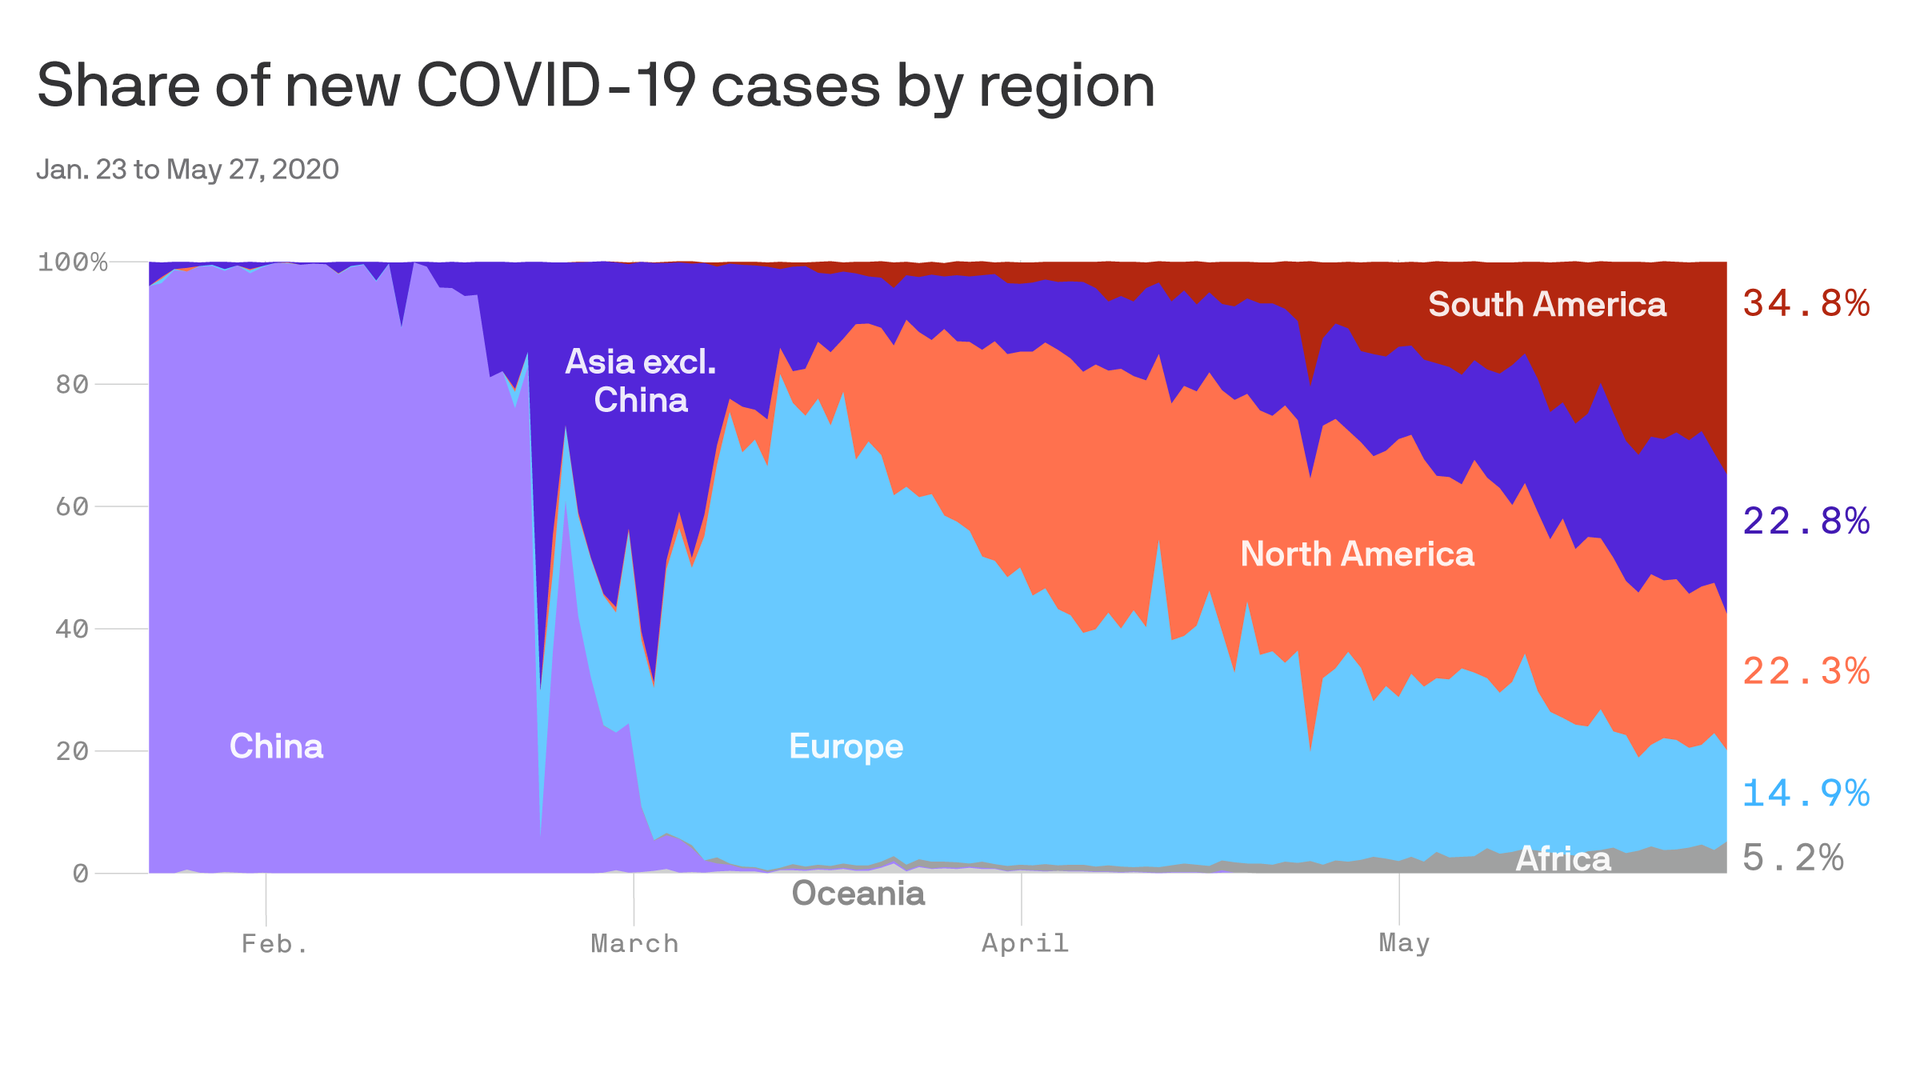
The eye of the coronavirus storm shifts to Latin America
Source: https://incomestatements.info
Category: Stock Reports
