See more : Zorlu Enerji Elektrik Üretim A.S. (ZOREN.IS) Income Statement Analysis – Financial Results
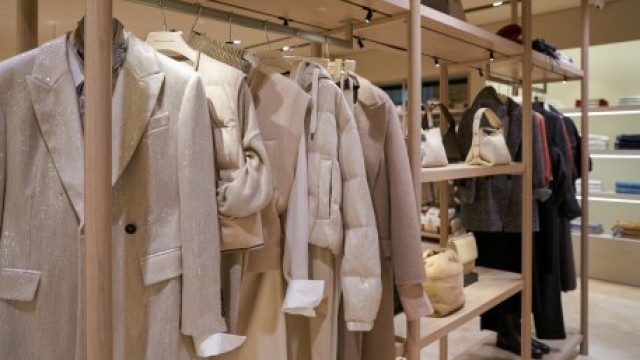
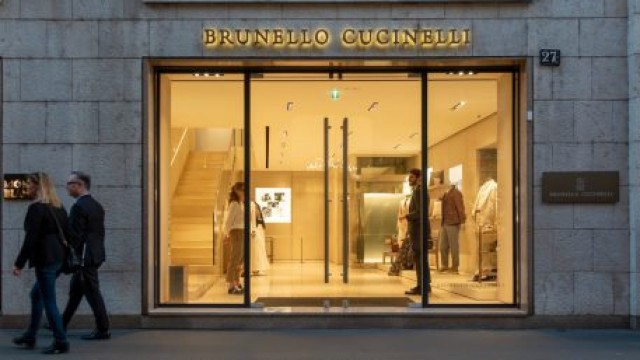
Complete financial analysis of Brunello Cucinelli S.p.A. (BCUCY) income statement, including revenue, profit margins, EPS and key performance metrics. Get detailed insights into the financial performance of Brunello Cucinelli S.p.A., a leading company in the Luxury Goods industry within the Consumer Cyclical sector.
- Pherecydes Pharma Société anonyme (ALPHE.PA) Income Statement Analysis – Financial Results
- Grupo Aeroméxico, S.A.B. de C.V. (GRPAQ) Income Statement Analysis – Financial Results
- Quick Heal Technologies Limited (QUICKHEAL.NS) Income Statement Analysis – Financial Results
- Shin-Etsu Chemical Co., Ltd. (4063.T) Income Statement Analysis – Financial Results
- Oliveda International, Inc. (OLVI) Income Statement Analysis – Financial Results
Brunello Cucinelli S.p.A. (BCUCY)
About Brunello Cucinelli S.p.A.
Brunello Cucinelli S.p.A., together with its subsidiaries, engages in the production and sale of clothing, accessories, and lifestyle products in Italy, Europe, North America, Japan, and China. The company offers women's collection, including coats and jackets, dresses, knitwear, t-shirts and tops, shirts, skirts, pants, denim, travel wear, sneakers, high-boots, loafers and flat shoes, sandals, leather goods, jewelry, scarves, other accessories, mini bags and clutches, crossbody bags and backpacks, and handbags and shoppers. It also provides men's collection, such as coats and jackets, knitwear, blazers and waistcoats, suits, tuxedos, t-shirts and polos, shirts, pants, denims, travel wear, sneakers, lace-ups, loafers, boots, leather goods, bags, scarves, and other accessories; and kids collections. In addition, the company offers lifestyle products, which include throw and blanket, cushion, studio products, candle and fragrance, bathrobe and towel, gardening products, travel essential, leisure bag, leisure wear, kitchen and table ware, table linen, and ceramic creation products, China, and internationally. As of December 31, 2021, it managed and operated 114 directly operated stores; and 30 wholesale monobrand boutiques. The company was founded in 1978 and is headquartered in Solomeo, Italy. Brunello Cucinelli S.p.A. is a subsidiary of Fedone S.r.l.
| Metric | 2023 | 2022 | 2021 | 2020 | 2019 | 2018 | 2017 | 2016 | 2015 | 2014 | 2013 | 2012 | 2011 | 2010 | 2009 |
|---|---|---|---|---|---|---|---|---|---|---|---|---|---|---|---|
| Revenue | 1.14B | 919.71M | 712.18M | 544.01M | 608.59M | 554.44M | 505.68M | 457.03M | 414.94M | 357.38M | 324.57M | 281.35M | 243.45M | 203.60M | 158.14M |
| Cost of Revenue | 537.08M | 465.61M | 381.25M | 293.76M | 317.96M | 353.91M | 317.54M | 291.45M | 264.75M | 226.40M | 210.58M | 193.12M | 163.10M | 152.44M | 122.46M |
| Gross Profit | 602.34M | 454.10M | 330.93M | 250.25M | 290.62M | 200.53M | 188.14M | 165.58M | 150.19M | 130.98M | 113.99M | 88.23M | 80.35M | 51.16M | 35.67M |
| Gross Profit Ratio | 52.86% | 49.37% | 46.47% | 46.00% | 47.75% | 36.17% | 37.21% | 36.23% | 36.19% | 36.65% | 35.12% | 31.36% | 33.01% | 25.13% | 22.56% |
| Research & Development | 0.00 | 0.00 | 0.00 | 0.00 | 10.58M | 0.00 | 620.00K | 0.00 | 0.00 | 0.00 | 0.00 | 0.00 | 0.00 | 0.00 | 0.00 |
| General & Administrative | 0.00 | 0.00 | 0.00 | 0.00 | 0.00 | 0.00 | 6.16M | 5.04M | 4.06M | 3.98M | 4.08M | 3.82M | 0.00 | 0.00 | 0.00 |
| Selling & Marketing | 0.00 | 0.00 | 0.00 | 0.00 | 0.00 | 0.00 | 41.38M | 37.46M | 36.49M | 31.15M | 29.63M | 28.15M | 0.00 | 0.00 | 0.00 |
| SG&A | 246.20M | 203.36M | 157.00M | 123.08M | 116.60M | 162.96M | 47.53M | 42.49M | 40.56M | 35.13M | 33.70M | 31.96M | 0.00 | 0.00 | 0.00 |
| Other Expenses | 168.73M | 311.20M | 256.48M | 229.98M | 205.98M | 129.85M | 2.11M | 1.06M | 786.00K | 1.47M | 2.09M | 2.03M | 45.68M | 29.90M | 23.72M |
| Operating Expenses | 414.93M | 311.20M | 256.48M | 229.98M | 205.98M | 129.85M | 116.87M | 106.71M | 97.61M | 79.36M | 65.25M | 51.33M | 45.68M | 29.90M | 23.72M |
| Cost & Expenses | 952.01M | 776.81M | 637.73M | 523.75M | 523.94M | 483.76M | 434.41M | 398.15M | 362.36M | 305.76M | 275.83M | 244.45M | 208.77M | 182.33M | 146.19M |
| Interest Income | 2.48M | 193.00K | 36.00K | 45.00K | 130.00K | 100.00K | 95.00K | 88.00K | 359.00K | 467.00K | 639.00K | 651.00K | 1.43M | 16.00K | 10.00K |
| Interest Expense | 18.37M | 14.14M | 12.03M | 12.92M | 12.03M | 1.08M | 1.37M | 1.69M | 2.10M | 2.07M | 1.50M | 1.63M | 3.99M | 886.00K | 835.00K |
| Depreciation & Amortization | 138.85M | 131.82M | 116.22M | 104.28M | 86.25M | 25.61M | 22.76M | 20.05M | 18.15M | 13.71M | 11.23M | 7.13M | 5.25M | 3.84M | 3.25M |
| EBITDA | 330.56M | 270.05M | 192.33M | 83.42M | 167.46M | 95.14M | 87.69M | 78.38M | 69.19M | 62.39M | 57.50M | 42.72M | 41.59M | 23.59M | 12.98M |
| EBITDA Ratio | 29.01% | 30.29% | 26.64% | 21.89% | 27.72% | 16.79% | 17.06% | 16.93% | 16.39% | 18.05% | 18.40% | 15.52% | 17.08% | 11.58% | 8.38% |
| Operating Income | 187.41M | 134.41M | 77.04M | 14.81M | 83.38M | 69.54M | 64.72M | 56.65M | 50.98M | 49.33M | 46.96M | 35.74M | 34.91M | 20.13M | 11.49M |
| Operating Income Ratio | 16.45% | 14.61% | 10.82% | 2.72% | 13.70% | 12.54% | 12.80% | 12.39% | 12.28% | 13.80% | 14.47% | 12.70% | 14.34% | 9.89% | 7.27% |
| Total Other Income/Expenses | -14.07M | -10.45M | -13.01M | -18.96M | -14.20M | -4.26M | -5.31M | -3.25M | -4.83M | -2.90M | -1.74M | -8.29M | -2.56M | -2.26M | -2.60M |
| Income Before Tax | 173.34M | 123.97M | 64.03M | -33.78M | 69.18M | 65.28M | 59.41M | 53.40M | 46.14M | 46.43M | 45.22M | 33.76M | 32.35M | 17.87M | 8.90M |
| Income Before Tax Ratio | 15.21% | 13.48% | 8.99% | -6.21% | 11.37% | 11.77% | 11.75% | 11.68% | 11.12% | 12.99% | 13.93% | 12.00% | 13.29% | 8.78% | 5.62% |
| Income Tax Expense | 49.53M | 36.76M | 7.73M | -1.71M | 16.09M | 14.24M | 6.93M | 16.28M | 13.19M | 14.64M | 15.65M | 11.52M | 11.33M | 6.43M | 3.37M |
| Net Income | 114.62M | 80.60M | 53.32M | -32.07M | 52.55M | 50.69M | 51.12M | 36.40M | 33.34M | 33.06M | 30.48M | 22.48M | 20.27M | 1.86M | 630.00K |
| Net Income Ratio | 10.06% | 8.76% | 7.49% | -5.89% | 8.64% | 9.14% | 10.11% | 7.96% | 8.03% | 9.25% | 9.39% | 7.99% | 8.33% | 0.91% | 0.40% |
| EPS | 1.69 | 1.19 | 0.78 | -0.47 | 0.77 | 0.37 | 0.38 | 0.27 | 0.25 | 0.24 | 0.22 | 0.17 | 0.17 | 0.02 | 0.01 |
| EPS Diluted | 1.69 | 1.19 | 0.78 | -0.47 | 0.77 | 0.37 | 0.38 | 0.27 | 0.25 | 0.24 | 0.22 | 0.17 | 0.17 | 0.02 | 0.00 |
| Weighted Avg Shares Out | 67.99M | 68.00M | 68.00M | 68.00M | 68.00M | 136.00M | 136.00M | 136.00M | 136.00M | 136.00M | 136.00M | 130.87M | 120.00M | 120.00M | 120.03M |
| Weighted Avg Shares Out (Dil) | 67.99M | 68.00M | 68.00M | 68.00M | 68.00M | 136.00M | 136.00M | 136.00M | 136.00M | 136.00M | 136.00M | 130.87M | 120.00M | 120.00M | 131.31M |

Brunello Cucinelli S.p.A. (BCUCF) Sales Conference Call (Transcript)

Brunello Cucinelli Backs Growth Targets as Sales Defy Luxury Slowdown

Brunello Cucinelli: Fair Value Revealed

Slow-Growth Luxury Play: The Long-Term Case For Brunello Cucinelli

Brunello Cucinelli S.p.A. (BCUCF) Q2 2024 Earnings Call Transcript

Brunello Cucinelli S.p.A. (BCUCF) Q2 2024 Earnings Call Transcript

Brunello Cucinelli S.p.A. (BCUCF) Q1 2024 Earnings Call Transcript

Brunello Cucinelli: When Consumers Recognize Product Value, They Spend

How Brunello Cucinelli And Neiman Marcus Make The Luxury Brand And Retailer Partnership Work

Quiet Luxury Brand Brunello Cucinelli Grows Sales Despite Inflation
Source: https://incomestatements.info
Category: Stock Reports
