See more : Grid Battery Metals Inc. (EVKRF) Income Statement Analysis – Financial Results
Complete financial analysis of Berkshire Grey, Inc. (BGRY) income statement, including revenue, profit margins, EPS and key performance metrics. Get detailed insights into the financial performance of Berkshire Grey, Inc., a leading company in the Industrial – Machinery industry within the Industrials sector.
- Zodiac-JRD-MKJ Limited (ZODJRDMKJ.NS) Income Statement Analysis – Financial Results
- Tobila Systems Inc. (4441.T) Income Statement Analysis – Financial Results
- Jackson Financial Inc. (JXN) Income Statement Analysis – Financial Results
- Financial Strategies Acquisition Corp. (FXCO) Income Statement Analysis – Financial Results
- KRAFTON, Inc. (259960.KS) Income Statement Analysis – Financial Results
Berkshire Grey, Inc. (BGRY)
About Berkshire Grey, Inc.
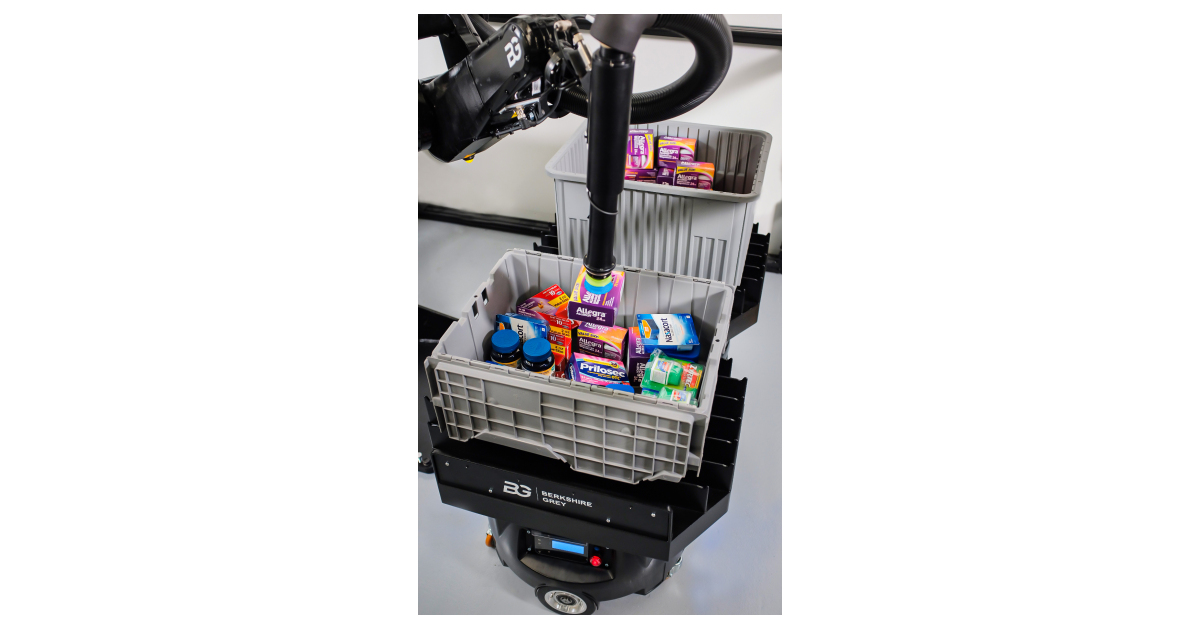
Berkshire Grey, Inc., an intelligent enterprise robotics company, provides AI-enabled robotic solutions that automate supply chain operations in the United States and Japan. The company's solutions automate filling ecommerce orders for consumers or businesses, filling orders to resupply retail stores and groceries, and handling packages shipped to fill those orders. It serves retail, ecommerce, grocery, package handling, and third-party logistics markets. The company was founded in 2013 and is headquartered in Bedford, Massachusetts.
| Metric | 2022 | 2021 | 2020 | 2019 |
|---|---|---|---|---|
| Revenue | 65.85M | 50.85M | 34.84M | 7.97M |
| Cost of Revenue | 71.12M | 59.10M | 32.01M | 9.97M |
| Gross Profit | -5.27M | -8.25M | 2.83M | -2.00M |
| Gross Profit Ratio | -8.00% | -16.22% | 8.11% | -25.11% |
| Research & Development | 72.58M | 63.82M | 35.81M | 27.81M |
| General & Administrative | 22.49M | 40.31M | 15.94M | 15.15M |
| Selling & Marketing | 13.50M | 51.96M | 12.91M | 5.27M |
| SG&A | 35.99M | 92.27M | 28.85M | 20.42M |
| Other Expenses | -1.40M | -76.00K | 3.91M | 142.00K |
| Operating Expenses | 108.57M | 156.09M | 64.65M | 48.23M |
| Cost & Expenses | 179.69M | 215.19M | 96.66M | 58.20M |
| Interest Income | 163.00K | 32.00K | 280.00K | 579.00K |
| Interest Expense | 0.00 | 0.00 | 0.00 | 0.00 |
| Depreciation & Amortization | -9.01M | -8.32M | 1.01M | 312.00K |
| EBITDA | -113.84M | -164.34M | -60.82M | -49.92M |
| EBITDA Ratio | -186.56% | -339.52% | -174.59% | -626.18% |
| Operating Income | -113.84M | -164.34M | -61.83M | -50.23M |
| Operating Income Ratio | -172.88% | -323.17% | -177.48% | -630.09% |
| Total Other Income/Expenses | 11.16M | 11.02M | 4.19M | 721.00K |
| Income Before Tax | -102.69M | -153.32M | -57.64M | -49.51M |
| Income Before Tax Ratio | -155.94% | -301.51% | -165.46% | -621.05% |
| Income Tax Expense | 108.00K | 58.00K | 5.00K | 1.00K |
| Net Income | -102.79M | -153.38M | -57.64M | -49.51M |
| Net Income Ratio | -156.10% | -301.62% | -165.47% | -621.06% |
| EPS | -0.44 | -1.33 | -2.59 | -2.23 |
| EPS Diluted | -0.44 | -1.33 | -2.59 | -2.23 |
| Weighted Avg Shares Out | 234.68M | 115.30M | 22.22M | 22.22M |
| Weighted Avg Shares Out (Dil) | 234.68M | 115.30M | 22.22M | 22.22M |

Ecommerce and Package Handling Companies Leverage Berkshire Grey AI-enabled Robotic Solutions to Meet Surging Demand Despite Labor Shortages

UPDATE -- Berkshire Grey's Picking With Purpose Donates Learning Kits for Boston Public School Students

Berkshire Grey Completes Business Combination with Revolution Acceleration Acquisition Corp and Will Begin Trading on Nasdaq Under the Symbol “BGRY”

Revolution Acceleration Acquisition Corp and Berkshire Grey Announce Filing of Definitive Proxy Statement/Prospectus and the July 20, 2021 Special Meeting to Approve Business Combination
Source: https://incomestatements.info
Category: Stock Reports
