See more : Tritium DCFC Limited (DCFC) Income Statement Analysis – Financial Results
Complete financial analysis of Bhang Inc. (BHNGF) income statement, including revenue, profit margins, EPS and key performance metrics. Get detailed insights into the financial performance of Bhang Inc., a leading company in the Drug Manufacturers – Specialty & Generic industry within the Healthcare sector.
- Aeon Hokkaido Corporation (7512.T) Income Statement Analysis – Financial Results
- Astika Holdings, Inc. (ASKH) Income Statement Analysis – Financial Results
- ALGOQUANT FINTECH LIMITED (AQFINTECH.BO) Income Statement Analysis – Financial Results
- Slack Technologies Inc (8S0.DE) Income Statement Analysis – Financial Results
- Embark Education Limited (EVO.AX) Income Statement Analysis – Financial Results
Bhang Inc. (BHNGF)
Industry: Drug Manufacturers - Specialty & Generic
Sector: Healthcare
Website: https://www.bhangnation.com
About Bhang Inc.
Bhang Inc. operates as a cannabis consumer packaged goods brand company in the United States. Its portfolio of products include cannabis; hempderived cannabidiol; and terpene products, including chocolates, pre-rolls, vapes, gums, beverages, and gummies. The company also provides milk chocolate, ice milk chocolate, caramel mocha milk chocolate, cherries and cream milk chocolate, caramel dark chocolate, dark chocolate, fire dark chocolate, blueberry dark chocolate, fried chicken and cola dark chocolate, toffee and salt dark chocolate, italian espresso dark chocolate, cookies and cream white chocolate, and white toast white chocolate bar; and infused joints, such as fig bars. In addition, it produces and distributes cannabis-infused products through partners and licensees that are distributed worldwide. Bhang Inc. is based in Toronto, Canada.
| Metric | 2021 | 2020 | 2019 | 2018 | 2017 | 2016 | 2015 | 2014 | 2013 | 2012 | 2011 | 2010 | 2009 | 2008 | 2007 | 2006 | 2005 | 2004 | 2003 | 2002 | 2001 |
|---|---|---|---|---|---|---|---|---|---|---|---|---|---|---|---|---|---|---|---|---|---|
| Revenue | 1.27M | 1.63M | 4.78M | 0.00 | 0.00 | 0.00 | 0.00 | 0.00 | 0.00 | 0.00 | 0.00 | 0.00 | 0.00 | 0.00 | 0.00 | 65.23K | 22.47K | 29.52K | 20.12K | 0.00 | 0.00 |
| Cost of Revenue | 424.74K | 718.62K | 5.28M | 675.00 | 4.69K | 0.00 | 0.00 | 0.00 | 0.00 | 0.00 | 0.00 | 0.00 | 0.00 | 0.00 | 0.00 | -7.61K | 0.00 | 0.00 | -7.09K | 0.00 | 0.00 |
| Gross Profit | 841.71K | 908.86K | -506.82K | -675.00 | -4.69K | 0.00 | 0.00 | 0.00 | 0.00 | 0.00 | 0.00 | 0.00 | 0.00 | 0.00 | 0.00 | 72.84K | 22.47K | 29.52K | 27.21K | 0.00 | 0.00 |
| Gross Profit Ratio | 66.46% | 55.84% | -10.61% | 0.00% | 0.00% | 0.00% | 0.00% | 0.00% | 0.00% | 0.00% | 0.00% | 0.00% | 0.00% | 0.00% | 0.00% | 111.66% | 100.00% | 100.00% | 135.22% | 0.00% | 0.00% |
| Research & Development | 0.00 | 0.00 | 0.00 | 0.00 | 0.00 | 0.00 | 0.00 | 0.00 | 0.00 | 0.00 | 0.00 | 0.00 | 0.00 | 0.00 | 0.00 | 0.00 | 0.00 | 0.00 | 0.00 | 0.00 | 0.00 |
| General & Administrative | 2.94M | 3.40M | 5.78M | 278.30K | 718.28K | 1.09M | 882.32K | 1.20M | 1.36M | 1.93M | 2.26M | 1.58M | 1.42M | 0.00 | 0.00 | 0.00 | 0.00 | 0.00 | 0.00 | 0.00 | 0.00 |
| Selling & Marketing | 873.26K | 263.02K | 1.84M | 4.73K | 21.22K | 0.00 | 0.00 | 0.00 | 0.00 | 0.00 | 0.00 | 0.00 | 0.00 | 0.00 | 0.00 | 0.00 | 0.00 | 0.00 | 0.00 | 0.00 | 0.00 |
| SG&A | 3.82M | 3.67M | 7.62M | 283.04K | 739.50K | 1.09M | 882.32K | 1.20M | 1.36M | 1.93M | 2.26M | 1.58M | 1.42M | 2.03M | 2.84M | 1.54M | 755.02K | 671.20K | 683.87K | 332.31K | 788.87K |
| Other Expenses | -48.10K | 4.50K | -252.50K | 75.29K | 8.01K | 0.00 | 0.00 | 0.00 | 0.00 | 0.00 | 0.00 | 0.00 | 0.00 | 276.43K | 42.38K | -368.70K | 131.05K | 0.00 | 3.09K | 27.63K | 0.00 |
| Operating Expenses | 3.77M | 3.60M | 8.07M | 249.71K | 831.90K | 1.27M | 888.19K | 1.35M | 1.37M | 1.94M | 2.29M | 1.63M | 1.66M | 2.07M | 2.86M | 1.56M | 779.82K | 684.93K | 690.67K | 307.07K | 794.23K |
| Cost & Expenses | 4.20M | 4.32M | 13.36M | 249.71K | 831.90K | 1.27M | 888.19K | 1.35M | 1.37M | 1.94M | 2.29M | 1.63M | 1.66M | 2.07M | 2.86M | 1.56M | 779.82K | 684.93K | 690.67K | 307.07K | 794.23K |
| Interest Income | 0.00 | 0.00 | 0.00 | 592.87 | 0.00 | 6.85 | 241.34 | 5.16K | 28.25K | 30.75K | 39.10K | 3.86K | 32.36K | 184.76K | 127.72K | 72.84K | 0.00 | 0.00 | 23.02K | 4.84K | 3.50K |
| Interest Expense | 30.72K | 84.46K | 131.64K | 0.00 | 53.10K | 0.00 | 0.00 | 0.00 | 0.00 | 0.00 | 0.00 | 0.00 | 0.00 | 0.00 | 0.00 | 0.00 | 0.00 | 0.00 | 0.00 | 0.00 | 0.00 |
| Depreciation & Amortization | 44.60K | 89.54K | 159.34K | 161.14K | 3.78K | 4.59K | 5.87K | 9.39K | 12.24K | 14.79K | 32.02K | 52.48K | 59.66K | 47.07K | 23.74K | 22.94K | 24.81K | 13.73K | 6.80K | 6.57K | 5.36K |
| EBITDA | -3.22M | -4.25M | -13.12M | -2.10M | -397.33K | -1.59M | -393.02K | -1.10M | -1.28M | 786.10K | -2.26M | 608.23K | -1.32M | -1.99M | -2.81M | -1.48M | -732.55K | -641.68K | -663.75K | -234.31K | -788.87K |
| EBITDA Ratio | -254.44% | -159.79% | -183.20% | 0.00% | 0.00% | 0.00% | 0.00% | 0.00% | 0.00% | 0.00% | 0.00% | 0.00% | 0.00% | 0.00% | 0.00% | -2,033.18% | -2,073.97% | -1,940.40% | -2,689.85% | 0.00% | 0.00% |
| Operating Income | -2.93M | -2.69M | -8.91M | -173.30K | -1.07M | -1.27M | -1.23M | -1.35M | -1.39M | -4.64M | -2.29M | 555.75K | -1.38M | -2.11M | -2.90M | -1.65M | -1.02M | -724.25K | -793.10K | -373.27K | -794.23K |
| Operating Income Ratio | -231.14% | -165.30% | -186.53% | 0.00% | 0.00% | 0.00% | 0.00% | 0.00% | 0.00% | 0.00% | 0.00% | 0.00% | 0.00% | 0.00% | 0.00% | -2,525.30% | -4,558.16% | -2,453.24% | -3,941.84% | 0.00% | 0.00% |
| Total Other Income/Expenses | -341.76K | -1.73M | -6.17M | 30.79K | -299.00K | 327.46K | -143.74K | -230.51K | -29.13K | 15.41K | 39.10K | -4.38M | -534.92K | 450.96K | 171.03K | -517.75K | -135.59K | -68.83K | -119.46K | -38.57K | 0.00 |
| Income Before Tax | -3.27M | -4.42M | -15.08M | 85.44K | -111.09K | -943.91K | -1.38M | -1.58M | -1.42M | -4.63M | -2.25M | -3.82M | -1.91M | -1.66M | -2.73M | -2.17M | -1.16M | -793.08K | -912.56K | -411.84K | 0.00 |
| Income Before Tax Ratio | -258.12% | -271.69% | -315.59% | 0.00% | 0.00% | 0.00% | 0.00% | 0.00% | 0.00% | 0.00% | 0.00% | 0.00% | 0.00% | 0.00% | 0.00% | -3,318.98% | -5,161.71% | -2,686.40% | -4,535.57% | 0.00% | 0.00% |
| Income Tax Expense | 29.02K | 85.65K | -202.40K | -85.33K | 61.11K | -64.02K | -304.22K | -327.84K | -168.03K | -1.19M | -453.14K | -1.22M | -454.76K | -587.03K | -674.33K | 149.04K | 266.63K | 68.83K | 125.65K | 63.15K | -2.22K |
| Net Income | -3.30M | -4.42M | -15.08M | 85.44K | -111.09K | -879.90K | -1.07M | -1.25M | -1.25M | -3.43M | -1.80M | -2.60M | -1.46M | -1.07M | -2.05M | -2.02M | -892.95K | -724.25K | -793.10K | -342.59K | -792.01K |
| Net Income Ratio | -260.41% | -271.48% | -315.59% | 0.00% | 0.00% | 0.00% | 0.00% | 0.00% | 0.00% | 0.00% | 0.00% | 0.00% | 0.00% | 0.00% | 0.00% | -3,090.51% | -3,974.83% | -2,453.24% | -3,941.84% | 0.00% | 0.00% |
| EPS | -0.02 | -0.03 | -0.15 | 0.00 | -0.01 | -0.04 | -0.06 | -0.07 | -0.08 | -0.24 | -0.14 | -0.26 | -0.16 | -0.13 | -0.30 | -0.37 | -0.19 | -0.17 | -0.24 | -0.13 | -0.33 |
| EPS Diluted | -0.02 | -0.03 | -0.15 | 0.00 | -0.01 | -0.04 | -0.06 | -0.07 | -0.08 | -0.24 | -0.14 | -0.26 | -0.16 | -0.13 | -0.30 | -0.37 | -0.19 | -0.17 | -0.24 | -0.13 | -0.33 |
| Weighted Avg Shares Out | 192.72M | 139.42M | 98.77M | 32.27M | 21.00M | 20.38M | 18.26M | 16.87M | 15.56M | 14.57M | 13.14M | 10.10M | 9.06M | 8.06M | 6.83M | 5.51M | 4.72M | 4.29M | 3.34M | 2.56M | 2.43M |
| Weighted Avg Shares Out (Dil) | 192.72M | 139.42M | 98.77M | 32.27M | 21.00M | 20.38M | 18.26M | 16.87M | 15.56M | 14.57M | 13.14M | 10.10M | 9.06M | 8.06M | 6.83M | 5.51M | 4.72M | 4.29M | 3.34M | 2.56M | 2.43M |

Bhang bolsters its board of directors with two industry experts
Bhang unveils plans to launch two new business units and announces collaboration with Peruvian street artist
Bhang partners with Hoodie Analytics to streamline sales insights and strategies
Jamie L Pearson to step down as cannabis company Bhang president
Bhang partners with cannabis marketing agency Petalfast to expand California presence

Bhang receives extension for filing its annual financial statements

Bhang says its chocolate receives OU Kosher certification in Florida
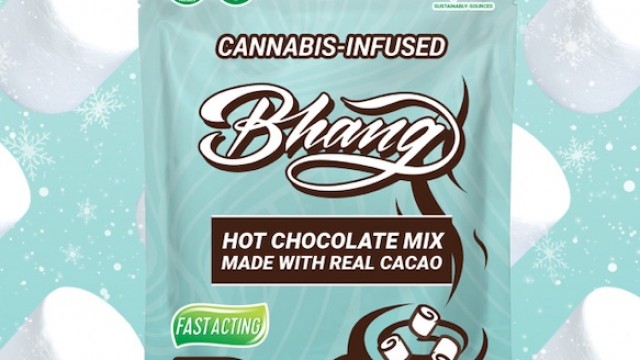
Bhang stands out in the crowd as a pioneer in cannabis edibles

Bhang closes non-brokered private placement of 22,147,400 units for aggregate gross proceeds of C$1,218,107

This Wildly Undervalued Cannabis Stock Could Go Parabolic in 2022
Source: https://incomestatements.info
Category: Stock Reports
