See more : Tesgas S.A. (TSG.WA) Income Statement Analysis – Financial Results
Complete financial analysis of boohoo group plc (BHOOY) income statement, including revenue, profit margins, EPS and key performance metrics. Get detailed insights into the financial performance of boohoo group plc, a leading company in the Specialty Retail industry within the Consumer Cyclical sector.
- Medico Remedies Limited (MEDICO.BO) Income Statement Analysis – Financial Results
- Anhui Anke Biotechnology (Group) Co., Ltd. (300009.SZ) Income Statement Analysis – Financial Results
- SEEK Limited (SKLTY) Income Statement Analysis – Financial Results
- DC Two Limited (DC2.AX) Income Statement Analysis – Financial Results
- CROOZ, Inc. (2138.T) Income Statement Analysis – Financial Results
boohoo group plc (BHOOY)
About boohoo group plc
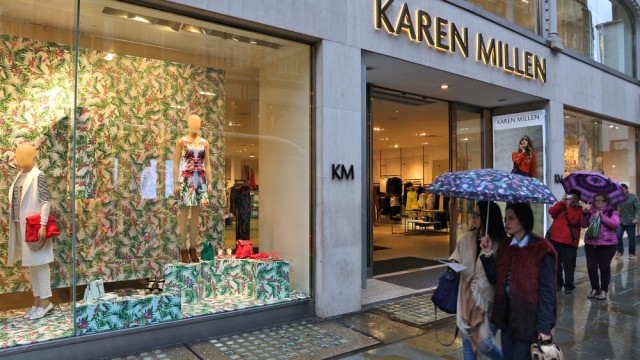
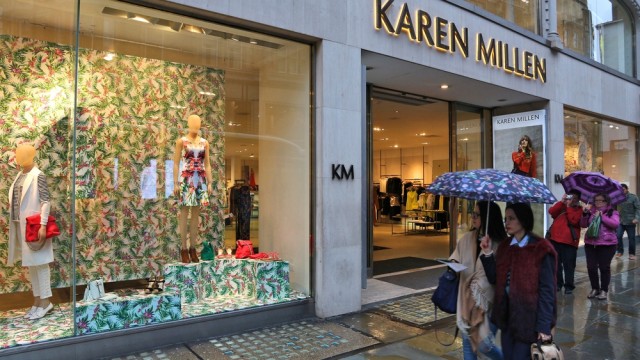
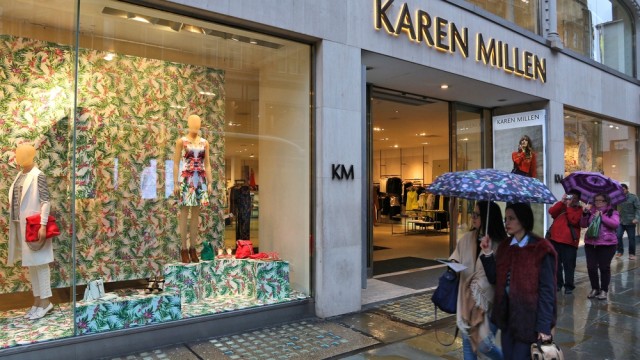
boohoo group plc, through its subsidiaries, operates as an online clothing retailer in the United Kingdom, rest of Europe, the United States, and internationally. The company designs, sources, markets, and sells clothing, shoes, accessories, and beauty products for 16-to-45-year age customers. It provides its products under the boohoo, boohooMAN, PrettyLittleThing, Nasty Gal, MissPap, Karen Millen, Coast, Oasis, Warehouse, Dorothy Perkins, Wallis, Burton, and Debenhams brands. boohoo group plc was founded in 2006 and is headquartered in Manchester, the United Kingdom.
| Metric | 2023 | 2022 | 2021 | 2020 | 2019 | 2018 | 2017 | 2016 | 2015 | 2014 | 2013 | 2012 |
|---|---|---|---|---|---|---|---|---|---|---|---|---|
| Revenue | 1.46B | 1.77B | 1.98B | 1.75B | 1.23B | 856.92M | 579.80M | 294.64M | 195.39M | 139.85M | 109.79M | 67.28M |
| Cost of Revenue | 704.90M | 873.50M | 941.70M | 800.10M | 568.64M | 387.93M | 273.45M | 133.81M | 82.48M | 54.81M | 44.88M | 30.62M |
| Gross Profit | 756.10M | 895.20M | 1.04B | 945.20M | 666.24M | 468.99M | 306.36M | 160.83M | 112.91M | 85.05M | 64.91M | 36.66M |
| Gross Profit Ratio | 51.75% | 50.61% | 52.51% | 54.16% | 53.95% | 54.73% | 52.84% | 54.59% | 57.79% | 60.81% | 59.12% | 54.49% |
| Research & Development | 0.00 | 0.00 | 0.00 | 0.00 | 0.00 | 0.00 | 0.00 | 0.00 | 0.00 | 0.00 | 0.00 | 0.00 |
| General & Administrative | 441.90M | 517.50M | 502.50M | 394.60M | 292.21M | 198.52M | 132.62M | 68.53M | 53.76M | 42.56M | 30.29M | 19.76M |
| Selling & Marketing | 431.50M | 447.90M | 516.50M | 422.00M | 278.25M | 207.08M | 126.76M | 66.85M | 45.50M | 30.65M | 24.29M | 13.61M |
| SG&A | 873.40M | 965.40M | 1.02B | 816.60M | 570.46M | 405.60M | 259.38M | 135.38M | 99.26M | 73.21M | 54.58M | 33.38M |
| Other Expenses | 29.60M | 100.00K | 100.00K | 1.00M | 238.00K | 239.00K | 159.00K | 0.00 | 0.00 | 0.00 | 0.00 | 0.00 |
| Operating Expenses | 903.00M | 977.50M | 1.03B | 822.10M | 575.58M | 410.05M | 263.83M | 130.52M | 97.87M | 73.21M | 54.09M | 33.38M |
| Cost & Expenses | 1.61B | 1.85B | 1.97B | 1.62B | 1.14B | 797.97M | 537.27M | 264.33M | 180.35M | 128.02M | 98.97M | 64.00M |
| Interest Income | 8.20M | 3.50M | 1.60M | 900.00K | 1.72M | 1.32M | 774.00K | 637.00K | 628.00K | 490.00K | 0.00 | 0.00 |
| Interest Expense | 21.20M | 12.00M | 1.60M | 300.00K | 390.00K | 144.00K | 146.00K | 0.00 | 0.00 | 0.00 | 84.00K | 102.00K |
| Depreciation & Amortization | 85.00M | 68.60M | 53.80M | 29.80M | 24.65M | 13.92M | 10.98M | 4.77M | 3.06M | 2.00M | 979.00K | 568.00K |
| EBITDA | -53.70M | -10.80M | 63.20M | 144.10M | 107.70M | 73.92M | 51.16M | 35.71M | 16.63M | 12.93M | 12.18M | 3.73M |
| EBITDA Ratio | -3.68% | -0.57% | 3.19% | 8.87% | 9.50% | 8.69% | 9.39% | 11.90% | 9.27% | 10.79% | 10.75% | 5.73% |
| Operating Income | -146.90M | -82.20M | 9.40M | 124.10M | 90.90M | 58.68M | 42.69M | 30.31M | 15.05M | 10.58M | 10.82M | 3.29M |
| Operating Income Ratio | -10.05% | -4.65% | 0.47% | 7.11% | 7.36% | 6.85% | 7.36% | 10.29% | 7.70% | 7.56% | 9.86% | 4.88% |
| Total Other Income/Expenses | -9.90M | -8.50M | -1.60M | 600.00K | 1.32M | 1.18M | 628.00K | 637.00K | 628.00K | 490.00K | -84.00K | -102.00K |
| Income Before Tax | -156.80M | -90.70M | 7.80M | 124.70M | 92.22M | 59.86M | 43.31M | 30.95M | 15.67M | 11.07M | 10.74M | 3.18M |
| Income Before Tax Ratio | -10.73% | -5.13% | 0.39% | 7.14% | 7.47% | 6.99% | 7.47% | 10.50% | 8.02% | 7.91% | 9.78% | 4.73% |
| Income Tax Expense | -19.00M | -15.10M | 11.80M | 31.30M | 19.34M | 12.40M | 7.31M | 6.28M | 3.24M | 2.66M | 2.31M | 614.00K |
| Net Income | -137.80M | -75.60M | -4.00M | 90.70M | 63.70M | 43.58M | 31.65M | 24.46M | 12.44M | 8.41M | 8.43M | 2.57M |
| Net Income Ratio | -9.43% | -4.27% | -0.20% | 5.20% | 5.16% | 5.09% | 5.46% | 8.30% | 6.37% | 6.01% | 7.68% | 3.82% |
| EPS | -0.11 | -0.06 | 0.00 | 0.07 | 0.05 | 0.76 | 0.56 | 0.44 | 0.22 | 0.15 | 0.15 | 0.05 |
| EPS Diluted | -0.11 | -0.06 | 0.00 | 0.07 | 0.05 | 0.74 | 0.54 | 0.43 | 0.22 | 0.15 | 0.15 | 0.05 |
| Weighted Avg Shares Out | 1.20B | 1.23B | 1.24B | 1.22B | 1.16B | 57.71M | 56.94M | 55.91M | 55.92M | 55.98M | 56.01M | 56.01M |
| Weighted Avg Shares Out (Dil) | 1.20B | 1.23B | 1.24B | 1.25B | 1.19B | 58.72M | 58.29M | 56.72M | 56.51M | 56.69M | 56.01M | 56.65M |
Boohoo share price nears a pivotal point as triangle pattern forms
Boohoo share price nears a pivotal point as triangle pattern forms

Boohoo Group Maximizes Personalization Across Its Site and Mobile Apps With AI-Powered Search and Merchandising From Bloomreach

ASOS, Boohoo agree to change green claims

ASOS, Boohoo facing downside as online-only retail under pressure - analysts

Best UK penny stocks to buy and hold in 2024
Boohoo share price is slowly forming 2 bullish patterns

Revolution Beauty is a market disruptor following boohoo coup - analyst

New letter details Boohoo's mounting supply chain woes

Boohoo's surprise update was brief but (somewhat) reassuring
Source: https://incomestatements.info
Category: Stock Reports
