See more : Kerry TJ Logistics Company Limited (2608.TW) Income Statement Analysis – Financial Results
Complete financial analysis of Blue Sky Uranium Corp. (BKUCF) income statement, including revenue, profit margins, EPS and key performance metrics. Get detailed insights into the financial performance of Blue Sky Uranium Corp., a leading company in the Uranium industry within the Energy sector.
- Reitmans (Canada) Limited (RTMAF) Income Statement Analysis – Financial Results
- Lenzing Aktiengesellschaft (LNZ.VI) Income Statement Analysis – Financial Results
- Onano Industrial Corp. (6405.TW) Income Statement Analysis – Financial Results
- Fidus Investment Corporation (FDUS) Income Statement Analysis – Financial Results
- Takara Holdings Inc. (2531.T) Income Statement Analysis – Financial Results
Blue Sky Uranium Corp. (BKUCF)
About Blue Sky Uranium Corp.
Blue Sky Uranium Corp., a junior uranium exploration company, engages in acquiring, exploring, and evaluating natural resource properties in Argentina. The company holds rights to approximately 400,000 hectares of properties in two provinces. Its flagship project is the Amarillo Grande project, which covers an area of approximately 261,000 hectares located in central Rio Negro province, in the Patagonia region of southern Argentina. The company was formerly known as Mulligan Capital Corp. and changed its name to Blue Sky Uranium Corp. in February 2007. Blue Sky Uranium Corp. was incorporated in 2005 and is based in Vancouver, Canada.
| Metric | 2023 | 2022 | 2021 | 2020 | 2019 | 2018 | 2017 | 2016 | 2015 | 2014 | 2013 | 2012 | 2011 | 2010 | 2009 | 2008 | 2007 | 2006 | 2005 |
|---|---|---|---|---|---|---|---|---|---|---|---|---|---|---|---|---|---|---|---|
| Revenue | 0.00 | 0.00 | 0.00 | 0.00 | 0.00 | 0.00 | 0.00 | 0.00 | 0.00 | 0.00 | 0.00 | 0.00 | 0.00 | 0.00 | 0.00 | 0.00 | 0.00 | 0.00 | 0.00 |
| Cost of Revenue | 46.54K | 86.07 | 56.07 | 61.75 | 47.90 | 3.28K | 3.58K | 298.00 | 13.10 | 38.73 | 0.00 | 0.00 | 0.00 | 0.00 | 0.00 | 0.00 | 412.49K | 0.00 | 0.00 |
| Gross Profit | -46.54K | -86.07 | -56.07 | -61.75 | -47.90 | -3.28K | -3.58K | -298.00 | -13.10 | -38.73 | 0.00 | 0.00 | 0.00 | 0.00 | 0.00 | 0.00 | -412.49K | 0.00 | 0.00 |
| Gross Profit Ratio | 0.00% | 0.00% | 0.00% | 0.00% | 0.00% | 0.00% | 0.00% | 0.00% | 0.00% | 0.00% | 0.00% | 0.00% | 0.00% | 0.00% | 0.00% | 0.00% | 0.00% | 0.00% | 0.00% |
| Research & Development | 0.00 | 0.00 | 1.89M | 130.07K | 661.28K | 761.42K | 697.18K | 128.09K | 6.23K | 90.49K | 99.67K | 127.26K | 213.08K | 287.76K | 98.06K | 213.89K | 0.00 | 1.49K | 0.00 |
| General & Administrative | 1.18M | 707.50K | 1.93M | 731.88K | 679.30K | 1.45M | 594.75K | 449.24K | 160.04K | 536.43K | 876.09K | 1.03M | 1.34M | 2.09M | 1.31M | 1.16M | 0.00 | 0.00 | 0.00 |
| Selling & Marketing | 1.34M | 0.00 | 0.00 | 0.00 | 0.00 | 0.00 | 0.00 | 0.00 | 0.00 | 0.00 | 0.00 | 0.00 | 0.00 | 0.00 | 0.00 | 0.00 | 0.00 | 0.00 | 0.00 |
| SG&A | 2.52M | 707.50K | 1.93M | 731.88K | 679.30K | 1.45M | 594.75K | 449.24K | 160.04K | 536.43K | 876.09K | 1.03M | 1.34M | 2.09M | 1.31M | 1.16M | 1.25M | 191.75K | 6.29K |
| Other Expenses | 1.61M | 5.32M | 3.56M | 1.39M | 1.47M | 2.35M | 3.54M | 746.86K | 63.14K | 230.67K | 1.96M | 1.05M | 1.99M | -18.39K | 143.90K | 12.69K | 1.26M | 192.70K | 6.29K |
| Operating Expenses | 4.13M | 6.02M | 7.38M | 2.25M | 2.81M | 4.56M | 4.83M | 1.32M | 229.41K | 857.59K | 2.94M | 2.21M | 3.54M | 5.57M | 2.06M | 2.69M | 1.26M | 194.19K | 6.29K |
| Cost & Expenses | 4.18M | 6.02M | 7.38M | 2.25M | 2.81M | 4.57M | 4.84M | 1.32M | 229.41K | 857.59K | 2.94M | 2.21M | 3.54M | 5.57M | 2.06M | 2.69M | 1.68M | 194.19K | 6.29K |
| Interest Income | 179.38K | 11.64K | 6.64K | 55.07 | 6.70K | 24.29K | 6.39K | 2.12K | 94.00 | 240.00 | 2.23K | 4.17K | 2.49K | 227.00 | 6.03K | 17.43K | 96.00K | 20.62K | 0.00 |
| Interest Expense | 0.00 | 0.00 | 1.98K | 55.07K | 3.54K | 0.00 | 0.00 | 20.82K | 29.53K | 52.59K | 0.00 | 0.00 | 0.00 | 0.00 | 0.00 | 0.00 | 0.00 | 0.00 | 0.00 |
| Depreciation & Amortization | 4.10M | 7.19M | 7.29M | 2.21M | 3.28K | 3.28K | 3.58K | 298.00 | -23.93K | 6.62K | 13.24K | 10.83K | 5.06K | 843.00 | 9.98K | 11.72K | 8.39K | 945.00 | 0.00 |
| EBITDA | 0.00 | 0.00 | 0.00 | 0.00 | -2.76M | -4.49M | -4.83M | -1.24M | -238.02K | -894.33K | -886.57K | -1.14K | -3.49M | -5.57M | -2.03M | -1.72M | -1.67M | -113.24K | -6.29K |
| EBITDA Ratio | 0.00% | 0.00% | 0.00% | 0.00% | 0.00% | 0.00% | 0.00% | 0.00% | 0.00% | 0.00% | 0.00% | 0.00% | 0.00% | 0.00% | 0.00% | 0.00% | 0.00% | 0.00% | 0.00% |
| Operating Income | -4.18M | -7.27M | -7.38M | -2.25M | -2.81M | -4.57M | -4.80M | -1.29M | -214.09K | -741.08K | -1.12M | -1.18M | -3.59M | -5.57M | -2.06M | -2.69M | -1.68M | -194.19K | -6.29K |
| Operating Income Ratio | 0.00% | 0.00% | 0.00% | 0.00% | 0.00% | 0.00% | 0.00% | 0.00% | 0.00% | 0.00% | 0.00% | 0.00% | 0.00% | 0.00% | 0.00% | 0.00% | 0.00% | 0.00% | 0.00% |
| Total Other Income/Expenses | 521.74K | 1.69M | 910.19K | 320.54K | 26.50K | 21.18K | 36.55K | -37.90K | -38.13K | -2.79M | 2.23K | -1.25M | 2.49K | -18.16K | 135.85K | -921.51K | -289.55K | -80.00K | 0.00 |
| Income Before Tax | -3.66M | -5.57M | -6.47M | -1.93M | -2.78M | -4.55M | -4.80M | -1.33M | -252.22K | -3.53M | -1.12M | -1.25M | -3.59M | -5.59M | -1.92M | -3.63M | -1.96M | -274.19K | 0.00 |
| Income Before Tax Ratio | 0.00% | 0.00% | 0.00% | 0.00% | 0.00% | 0.00% | 0.00% | 0.00% | 0.00% | 0.00% | 0.00% | 0.00% | 0.00% | 0.00% | 0.00% | 0.00% | 0.00% | 0.00% | 0.00% |
| Income Tax Expense | 0.00 | -1.69M | -4.65K | 55.07K | -3.15K | 21.18K | 0.00 | 20.82K | 53.46K | 52.59K | -1.82M | -960.77K | 43.61K | -227.00 | -771.42K | 934.20K | -96.00K | -20.62K | 6.29K |
| Net Income | -3.66M | -3.88M | -6.47M | -1.98M | -2.78M | -4.55M | -4.80M | -1.33M | -252.22K | -3.53M | -1.12M | -1.25M | -3.59M | -5.59M | -1.15M | -3.61M | -1.87M | -173.57K | -6.29K |
| Net Income Ratio | 0.00% | 0.00% | 0.00% | 0.00% | 0.00% | 0.00% | 0.00% | 0.00% | 0.00% | 0.00% | 0.00% | 0.00% | 0.00% | 0.00% | 0.00% | 0.00% | 0.00% | 0.00% | 0.00% |
| EPS | -0.02 | -0.02 | -0.04 | -0.02 | -0.02 | -0.05 | -0.08 | -0.06 | -0.07 | -1.07 | -0.46 | -0.84 | -4.31 | -8.53 | -2.65 | -14.35 | -11.51 | -1.96 | -0.50 |
| EPS Diluted | -0.02 | -0.02 | -0.04 | -0.02 | -0.02 | -0.05 | -0.08 | -0.06 | -0.07 | -1.07 | -0.46 | -0.84 | -4.31 | -8.53 | -2.65 | -14.35 | -11.51 | -1.96 | -0.50 |
| Weighted Avg Shares Out | 232.99M | 193.86M | 166.69M | 120.11M | 113.01M | 97.47M | 62.57M | 23.24M | 3.44M | 3.30M | 2.44M | 1.49M | 832.95K | 655.38K | 434.50K | 251.48K | 162.42K | 88.72K | 12.63K |
| Weighted Avg Shares Out (Dil) | 232.99M | 193.86M | 166.69M | 120.11M | 113.01M | 97.47M | 62.57M | 23.24M | 3.44M | 3.30M | 2.44M | 1.49M | 832.95K | 655.38K | 434.50K | 251.48K | 162.42K | 88.72K | 12.63K |

Blue Sky Uranium to refine drill targets with field exploration program at Amarillo Grande Uranium-Vanadium Project in Argentina
Blue Sky Uranium reveals promising assay results from Amarillo Grande Uranium-Vanadium Project in Argentina

Blue Sky Uranium closes final private placement tranche; raises more than C$339K

Blue Sky Uranium closes $907K second tranche of private placement
Blue Sky Uranium closes first tranche of non-brokered private placement for gross proceeds of $854,100
Blue Sky Uranium announces non-brokered private placement to fund exploration at its Argentina projects
Blue Sky Uranium applies to TSX Venture Exchange to extend term of outstanding warrants
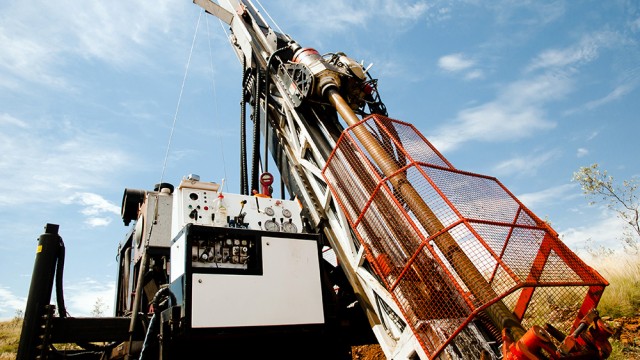
Blue Sky Uranium resumes exploration drilling at targets near its Ivana deposit in Argentina

Blue Sky Uranium says results from drill program at Ivana deposit in Argentina indicate “great success”
Source: https://incomestatements.info
Category: Stock Reports
