Complete financial analysis of Bloomin’ Brands, Inc. (BLMN) income statement, including revenue, profit margins, EPS and key performance metrics. Get detailed insights into the financial performance of Bloomin’ Brands, Inc., a leading company in the Restaurants industry within the Consumer Cyclical sector.
- Hexagon Composites ASA (0EOF.L) Income Statement Analysis – Financial Results
- Burberry Group plc (BBRYF) Income Statement Analysis – Financial Results
- Energie Europe Service (MLEES.PA) Income Statement Analysis – Financial Results
- Yoshicon Co.,Ltd. (5280.T) Income Statement Analysis – Financial Results
- AlloVir, Inc. (ALVR) Income Statement Analysis – Financial Results
Bloomin' Brands, Inc. (BLMN)
About Bloomin' Brands, Inc.
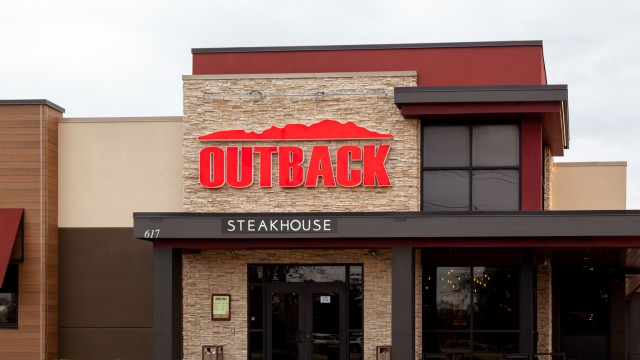
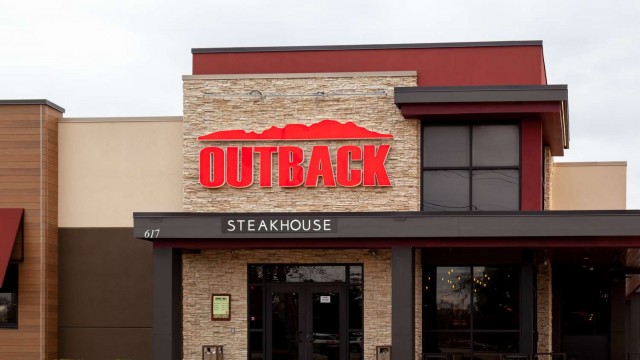
Bloomin' Brands, Inc., through its subsidiaries, owns and operates casual, upscale casual, and fine dining restaurants in the United States and internationally. The company operates through two segments, U.S. and International. Its restaurant portfolio has four concepts, including Outback Steakhouse, a casual steakhouse restaurant; Carrabba's Italian Grill, a casual Italian restaurant; Bonefish Grill; and Fleming's Prime Steakhouse & Wine Bar, a contemporary steakhouse. As of December 26, 2021, the company owned and operated 1,013 full-service restaurants and franchised 157 restaurants across 47 states; and 156 full-service restaurants and franchised 172 restaurants across 17 countries and Guam. The company was founded in 1988 and is based in Tampa, Florida.
| Metric | 2023 | 2022 | 2021 | 2020 | 2019 | 2018 | 2017 | 2016 | 2015 | 2014 | 2013 | 2012 | 2011 | 2010 | 2009 |
|---|---|---|---|---|---|---|---|---|---|---|---|---|---|---|---|
| Revenue | 4.67B | 4.42B | 4.12B | 3.17B | 4.14B | 4.13B | 4.21B | 4.25B | 4.38B | 4.44B | 4.13B | 3.99B | 3.84B | 3.63B | 3.60B |
| Cost of Revenue | 3.86B | 3.68B | 3.39B | 2.83B | 3.47B | 3.46B | 3.52B | 3.56B | 3.63B | 3.70B | 3.46B | 3.32B | 1.23B | 3.05B | 1.18B |
| Gross Profit | 810.36M | 740.75M | 731.70M | 336.00M | 672.23M | 666.43M | 697.66M | 694.05M | 745.61M | 739.34M | 673.49M | 670.65M | 2.62B | 577.68M | 2.42B |
| Gross Profit Ratio | 17.35% | 16.77% | 17.75% | 10.60% | 16.24% | 16.15% | 16.56% | 16.32% | 17.03% | 16.64% | 16.31% | 16.82% | 68.08% | 15.92% | 67.12% |
| Research & Development | 3.50M | 2.70M | 2.60M | 2.40M | 3.40M | 3.80M | 3.90M | 5.20M | 6.50M | 5.80M | 6.40M | 7.30M | 0.00 | 0.00 | 0.00 |
| General & Administrative | 260.47M | 234.75M | 245.62M | 254.36M | 275.24M | 282.72M | 306.96M | 267.98M | 287.61M | 304.38M | 268.93M | 326.47M | 2.28B | 252.79M | 2.13B |
| Selling & Marketing | 0.00 | 0.00 | 0.00 | 0.00 | 0.00 | 0.00 | 0.00 | 0.00 | 0.00 | 0.00 | 0.00 | 0.00 | 0.00 | 0.00 | 0.00 |
| SG&A | 260.47M | 234.75M | 245.62M | 254.36M | 275.24M | 282.72M | 306.96M | 267.98M | 287.61M | 304.38M | 268.93M | 326.47M | 2.28B | 252.79M | 2.13B |
| Other Expenses | 221.25M | 169.62M | 163.39M | 180.26M | 196.81M | -11.00K | 14.91M | 1.61M | -939.00K | -1.24M | -246.00K | -128.00K | 126.47M | 2.99M | 342.66M |
| Operating Expenses | 485.22M | 404.37M | 409.01M | 434.62M | 472.05M | 484.31M | 499.24M | 461.82M | 478.01M | 495.29M | 433.02M | 481.96M | 2.40B | 409.06M | 2.47B |
| Cost & Expenses | 4.35B | 4.08B | 3.80B | 3.27B | 3.94B | 3.94B | 4.01B | 4.02B | 4.11B | 4.20B | 3.89B | 3.80B | 3.63B | 3.46B | 3.65B |
| Interest Income | 0.00 | 53.18M | 57.61M | 64.44M | 49.26M | 0.00 | 0.00 | 0.00 | 0.00 | 0.00 | 0.00 | 0.00 | 0.00 | 0.00 | -15.57M |
| Interest Expense | 52.17M | 53.18M | 57.61M | 64.44M | 49.26M | 44.94M | 41.39M | 45.73M | 56.18M | 59.66M | 74.77M | 86.64M | 83.39M | 91.43M | 100.31M |
| Depreciation & Amortization | 191.17M | 252.87M | 241.66M | 254.70M | 270.17M | 201.59M | 192.28M | 193.84M | 190.40M | 190.91M | 164.09M | 155.48M | 153.69M | 156.27M | 186.07M |
| EBITDA | 516.32M | 515.40M | 491.49M | 81.77M | 398.29M | 385.31M | 383.11M | 289.81M | 413.77M | 370.54M | 404.96M | 315.53M | 366.31M | 326.74M | 134.94M |
| EBITDA Ratio | 11.05% | 11.46% | 11.79% | 2.58% | 9.59% | 9.30% | 9.63% | 10.06% | 10.44% | 9.76% | 10.87% | 8.76% | 9.54% | 9.19% | 0.98% |
| Operating Income | 325.14M | 330.42M | 308.96M | -98.49M | 191.09M | 145.25M | 146.09M | 127.61M | 230.93M | 191.96M | 225.36M | 181.14M | 213.45M | 168.91M | -109.29M |
| Operating Income Ratio | 6.96% | 7.48% | 7.49% | -3.11% | 4.62% | 3.52% | 3.47% | 3.00% | 5.28% | 4.32% | 5.46% | 4.54% | 5.56% | 4.66% | -3.03% |
| Total Other Income/Expenses | -52.17M | -178.51M | -59.66M | -64.55M | -49.40M | -44.95M | -27.55M | -67.26M | -60.07M | -71.99M | -53.00M | -112.08M | -82.56M | -88.44M | 41.98M |
| Income Before Tax | 272.98M | 151.91M | 249.30M | -239.52M | 141.69M | 100.31M | 118.54M | 56.49M | 170.85M | 119.97M | 172.36M | 73.41M | 130.90M | 80.48M | -67.31M |
| Income Before Tax Ratio | 5.84% | 3.44% | 6.05% | -7.55% | 3.42% | 2.43% | 2.81% | 1.33% | 3.90% | 2.70% | 4.17% | 1.84% | 3.41% | 2.22% | -1.87% |
| Income Tax Expense | 18.56M | 42.70M | 26.38M | -80.73M | 7.57M | -9.23M | 15.99M | 10.14M | 39.29M | 24.04M | -42.21M | 12.11M | 21.72M | 21.30M | -2.46M |
| Net Income | 247.39M | 101.91M | 215.56M | -158.80M | 130.57M | 107.10M | 100.24M | 41.75M | 127.33M | 91.09M | 208.37M | 49.97M | 100.01M | 52.97M | -64.46M |
| Net Income Ratio | 5.30% | 2.31% | 5.23% | -5.01% | 3.15% | 2.60% | 2.38% | 0.98% | 2.91% | 2.05% | 5.05% | 1.25% | 2.60% | 1.46% | -1.79% |
| EPS | 2.84 | 1.15 | 2.42 | -1.82 | 1.47 | 1.16 | 1.05 | 0.35 | 1.04 | 0.73 | 1.69 | 0.45 | 0.94 | 0.50 | -0.62 |
| EPS Diluted | 2.56 | 1.03 | 2.00 | -1.82 | 1.45 | 1.14 | 1.02 | 0.34 | 1.01 | 0.71 | 1.63 | 0.44 | 0.93 | 0.49 | -0.62 |
| Weighted Avg Shares Out | 87.23M | 88.85M | 88.98M | 87.47M | 88.84M | 92.04M | 96.37M | 111.38M | 122.35M | 125.14M | 122.97M | 112.00M | 106.36M | 106.36M | 104.44M |
| Weighted Avg Shares Out (Dil) | 96.45M | 98.51M | 107.80M | 87.47M | 89.78M | 94.08M | 99.71M | 114.31M | 125.59M | 128.32M | 128.07M | 114.82M | 107.26M | 107.26M | 104.44M |

Bloomin' Brands: Starboard's Involvement Signals Potential For Increased Shareholder Value

4 Stocks to Buy on a Dip

Outback Steakhouse Parent Bloomin' Brands Pares Back Gains After Adding New Board Members

Bloomin' Brands stock higher on cooperation deal with activist investor

Dave George and Jon Sagal Appointed to Bloomin' Brands Board of Directors

Small-cap surge: Outpacing large caps on hopes for '24 rate cuts

Bloomin' Brands: Upside Remains Attractive Despite Conservative Assumptions

Bloomin' Brands, Inc. (BLMN) Q3 2023 Earnings Call Transcript

Bloomin' Brands (BLMN) Q3 Earnings: Taking a Look at Key Metrics Versus Estimates

Bloomin' Brands (BLMN) Tops Q3 Earnings Estimates
Source: https://incomestatements.info
Category: Stock Reports
