See more : The ODP Corporation (ODP) Income Statement Analysis – Financial Results
Complete financial analysis of BELLUS Health Inc. (BLU) income statement, including revenue, profit margins, EPS and key performance metrics. Get detailed insights into the financial performance of BELLUS Health Inc., a leading company in the Biotechnology industry within the Healthcare sector.
- Patagonia Gold Corp. (PGDC.V) Income Statement Analysis – Financial Results
- Kernex Microsystems (India) Limited (KERNEX.NS) Income Statement Analysis – Financial Results
- Lion Corporation (4912.T) Income Statement Analysis – Financial Results
- Strasbaugh (STRB) Income Statement Analysis – Financial Results
- China Clean Energy Inc. (CCGY) Income Statement Analysis – Financial Results
BELLUS Health Inc. (BLU)
About BELLUS Health Inc.
BELLUS Health Inc., a clinical stage biopharmaceutical company, develops therapeutics for the treatment of refractory chronic cough (RCC) and other cough hypersensitivity indications. Its lead product candidate includes BLU-5937, an antagonist of the P2X3 receptor, which is in Phase II clinical trial for treatment of RCC and chronic pruritus. The company was incorporated in 1993 and is based in Laval, Canada.
| Metric | 2022 | 2021 | 2020 | 2019 | 2018 | 2017 | 2016 | 2015 | 2014 | 2013 | 2012 | 2011 | 2010 | 2009 | 2008 | 2007 | 2006 | 2005 | 2004 | 2003 | 2001 | 2000 | 1999 |
|---|---|---|---|---|---|---|---|---|---|---|---|---|---|---|---|---|---|---|---|---|---|---|---|
| Revenue | 16.00K | 16.00K | 15.00K | 26.79K | 25.70K | 131.21K | 1.41M | 2.90M | 2.05M | 2.12M | 2.31M | 3.00M | 2.41M | -116.00K | 584.00K | 1.51M | 2.74M | 2.91M | 109.80K | 0.00 | 2.25M | 5.52M | 118.83K |
| Cost of Revenue | 3.51B | 2.22B | 1.43B | 994.51M | 0.00 | 0.00 | 0.00 | 0.00 | 0.00 | -137.23K | 0.00 | 0.00 | 0.00 | 0.00 | 0.00 | 0.00 | 693.62K | -470.29K | 0.00 | 0.00 | -1.16M | 0.00 | 0.00 |
| Gross Profit | -3.51B | -2.22B | -1.43B | -994.49M | 25.70K | 131.21K | 1.41M | 2.90M | 2.05M | 2.26M | 2.31M | 3.00M | 2.41M | -116.00K | 584.00K | 1.51M | 2.05M | 3.38M | 109.80K | 0.00 | 3.41M | 5.52M | 118.83K |
| Gross Profit Ratio | -21,967,104.08% | -13,887,173.94% | -9,536,119.55% | -3,711,740.75% | 100.00% | 100.00% | 100.00% | 100.00% | 100.00% | 106.48% | 100.00% | 100.00% | 100.00% | 100.00% | 100.00% | 100.00% | 74.71% | 116.14% | 100.00% | 0.00% | 151.65% | 100.00% | 100.00% |
| Research & Development | 58.89M | 59.79M | 23.73M | 20.00M | 5.28M | 2.87M | 1.13M | 931.76K | 1.46M | 1.19M | 998.16K | 1.29M | 7.05M | 10.04M | 23.60M | 55.45M | 49.54M | 40.61M | 24.42M | 5.71M | 8.03M | 6.56M | 3.19M |
| General & Administrative | 19.50M | 14.26M | 9.74M | 6.68M | 2.50M | 2.01M | 1.95M | 2.25M | 2.71M | 4.01M | 4.99M | 0.00 | 7.69M | 8.57M | 11.79M | 0.00 | 0.00 | 0.00 | 0.00 | 0.00 | 0.00 | 0.00 | 0.00 |
| Selling & Marketing | 0.00 | 0.00 | 0.00 | 0.00 | 0.00 | 0.00 | 0.00 | 0.00 | 0.00 | 0.00 | 0.00 | 0.00 | 611.90K | 3.71M | 6.66M | 0.00 | 0.00 | 0.00 | 0.00 | 0.00 | 0.00 | 0.00 | 0.00 |
| SG&A | 19.50M | 14.26M | 9.74M | 6.68M | 2.50M | 2.01M | 1.95M | 2.25M | 2.71M | 4.01M | 4.99M | 3.47M | 8.30M | 12.28M | 18.45M | 15.17M | 14.67M | 23.25M | 18.29M | 5.75M | 2.44M | 396.43K | 1.02M |
| Other Expenses | -491.00K | -754.00K | -507.00K | -543.53K | -479.43K | 0.00 | 0.00 | 0.00 | 0.00 | 0.00 | 653.38K | 5.34M | -5.05M | 13.11M | 1.05M | 0.00 | 0.00 | 0.00 | 0.00 | 0.00 | 0.00 | 0.00 | 0.00 |
| Operating Expenses | 77.90M | 73.30M | 32.96M | 26.13M | 7.30M | 4.65M | 2.97M | 2.98M | 4.17M | 5.21M | 5.95M | 4.76M | 17.10M | 21.00M | 46.24M | 70.16M | 65.73M | 66.60M | 44.41M | 11.95M | 11.06M | 7.23M | 4.43M |
| Cost & Expenses | 77.90M | 73.30M | 32.96M | 26.13M | 7.30M | 4.65M | 2.97M | 2.98M | 4.17M | 5.21M | 5.95M | 4.76M | 17.10M | 21.00M | 46.24M | 70.16M | 66.42M | 66.60M | 44.41M | 11.95M | 11.06M | 7.23M | 4.43M |
| Interest Income | 5.08M | 233.00K | 1.05M | 1.16M | 265.78K | 63.62K | 74.40K | 104.49K | 170.56K | 189.71K | 137.71K | 105.78K | 151.98K | 102.00K | 907.00K | 0.00 | 2.36M | 2.08M | 0.00 | 520.42K | 1.14M | 0.00 | 0.00 |
| Interest Expense | 78.00K | 55.00K | 39.00K | 22.97K | 3.67K | 8.75K | 8.18K | 7.93K | 89.59K | 133.36K | 220.14K | 333.01K | 526.92K | 324.00K | 271.00K | 0.00 | 151.45K | 461.68K | 0.00 | 46.37K | 232.00K | 0.00 | 0.00 |
| Depreciation & Amortization | 5.12M | 426.00K | 1.22M | 1.28M | 325.25K | 63.62K | 49.10K | 104.49K | 345.43K | 658.36K | -17.49M | 45.05K | 1.47M | 693.00K | 1.88M | 399.00K | 335.82K | 2.60M | 1.70M | 497.67K | 585.56K | 278.82K | 224.15K |
| EBITDA | -72.76M | -72.86M | -31.72M | -24.82M | -6.95M | -4.46M | -1.51M | 28.10K | -1.78M | -2.43M | -21.12M | -1.71M | -13.22M | -7.21M | -46.07M | -66.97M | -62.16M | -60.94M | -42.60M | -11.46M | -8.22M | -1.44M | -4.09M |
| EBITDA Ratio | -454,768.75% | -455,362.50% | -211,453.33% | -92,637.22% | -27,038.13% | -3,396.99% | -107.29% | 0.97% | -87.04% | -114.72% | -914.36% | -56.95% | -549.21% | 6,215.52% | -7,888.36% | -4,443.66% | -2,266.69% | -2,091.58% | -38,800.14% | 0.00% | -365.10% | -26.07% | -3,440.36% |
| Operating Income | -77.88M | -73.28M | -32.94M | -26.10M | -7.27M | -4.52M | -1.56M | -76.39K | -2.13M | -3.09M | -3.64M | -1.76M | -14.69M | -21.12M | -45.66M | -68.66M | -63.68M | -63.69M | -44.30M | -11.95M | -8.81M | -1.72M | -4.31M |
| Operating Income Ratio | -486,768.75% | -458,025.00% | -219,613.33% | -97,431.66% | -28,303.89% | -3,445.47% | -110.78% | -2.63% | -103.91% | -145.79% | -157.40% | -58.45% | -610.09% | 18,204.31% | -7,817.64% | -4,555.81% | -2,321.87% | -2,185.81% | -40,350.15% | 0.00% | -391.10% | -31.13% | -3,629.00% |
| Total Other Income/Expenses | 1.86M | 1.86M | 1.19M | -280.19K | 603.51K | 3.08M | -86.30K | 348.78K | 389.37K | 2.18M | -9.60M | 5.34M | -5.05M | 12.89M | -2.57M | -12.42M | -999.45K | 1.38M | 714.67K | -1.35M | 74.51K | 0.00 | 316.65K |
| Income Before Tax | -76.02M | -71.42M | -31.76M | -26.39M | -6.67M | -1.44M | -1.65M | 272.40K | -1.74M | -911.93K | -13.24M | 3.58M | -19.73M | -8.23M | -48.22M | -81.07M | -64.68M | -62.31M | -43.59M | -13.30M | -8.73M | 0.00 | -4.00M |
| Income Before Tax Ratio | -475,125.00% | -446,393.75% | -211,713.33% | -98,477.40% | -25,955.23% | -1,098.79% | -116.90% | 9.39% | -84.89% | -43.04% | -573.11% | 119.24% | -819.68% | 7,092.24% | -8,257.36% | -5,379.76% | -2,358.31% | -2,138.42% | -39,699.24% | 0.00% | -387.79% | 0.00% | -3,362.52% |
| Income Tax Expense | 60.00K | -199.00K | 39.00K | 22.97K | -607.18K | 48.51K | 11.16K | -19.46K | -42.21K | -617.97K | 18.44M | 227.23K | 374.94K | 13.44M | 1.32M | -1.94M | -1.50M | -2.04M | -626.83K | -365.56K | 152.98K | 58.14K | -227.53K |
| Net Income | -76.08M | -71.22M | -31.80M | -26.41M | -6.06M | -1.49M | -1.61M | 145.57K | -1.66M | -818.96K | -13.32M | 3.35M | -20.11M | -8.23M | -48.22M | -81.07M | -64.68M | -62.31M | -43.59M | -12.93M | -8.89M | -1.78M | -3.77M |
| Net Income Ratio | -475,500.00% | -445,150.00% | -211,973.33% | -98,563.12% | -23,592.29% | -1,135.76% | -114.05% | 5.02% | -81.27% | -38.65% | -576.81% | 111.68% | -835.26% | 7,092.24% | -8,257.36% | -5,379.76% | -2,358.31% | -2,138.42% | -39,699.24% | 0.00% | -394.58% | -32.18% | -3,171.04% |
| EPS | -0.66 | -0.90 | -0.54 | -0.09 | -0.18 | -0.08 | -0.10 | 0.01 | -0.13 | -0.06 | -1.48 | 1.38 | -10.28 | -6.34 | -105.15 | -198.86 | -181.01 | -196.26 | -156.38 | -52.10 | -53.29 | -11.00 | -32.16 |
| EPS Diluted | -0.66 | -0.90 | -0.54 | -0.09 | -0.18 | -0.08 | -0.10 | 0.01 | -0.13 | -0.06 | -1.48 | -0.67 | -10.28 | -6.30 | -105.15 | -198.86 | -181.01 | -187.15 | -137.04 | -44.64 | -49.86 | -11.00 | -32.16 |
| Weighted Avg Shares Out | 115.36M | 79.32M | 59.02M | 294.74M | 33.62M | 19.07M | 16.22M | 13.17M | 13.17M | 13.17M | 8.98M | 2.47M | 1.96M | 1.30M | 458.62K | 407.69K | 357.31K | 317.48K | 278.73K | 248.27K | 166.73K | 161.45K | 117.17K |
| Weighted Avg Shares Out (Dil) | 115.36M | 79.32M | 59.02M | 294.74M | 33.62M | 19.07M | 16.22M | 13.17M | 13.17M | 13.17M | 8.98M | 6.04M | 1.96M | 1.31M | 458.62K | 407.69K | 357.31K | 332.93K | 318.06K | 289.73K | 178.21K | 161.45K | 117.17K |

Bellus Health Soars 98% As GSK Joins Buyout Bonanza With $2 Billion Deal

Bellus Health's stock climbs on GSK deal, while Goldman Sachs is hurt by a revenue miss

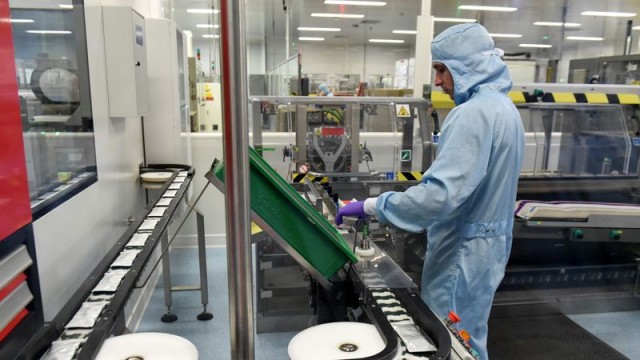
GSK pays £1.6bn for Canada's Bellus Health

GSK to acquire U.S.-based BELLUS Health for $14.75 per share


Wall Street Analysts Think Bellus (BLU) Could Surge 156.01%: Read This Before Placing a Bet

BELLUS Health Reports Year 2022 Financial Results and Business Highlights

BELLUS Health to Participate in the Cowen 43rd Annual Health Care Conference

Bellus Health: Building Momentum Around CALM, SOOTHE Studies

Bellus Health (BLU) Reports Q3 Loss, Misses Revenue Estimates
Source: https://incomestatements.info
Category: Stock Reports
