See more : Johnson Controls International plc (0Y7S.L) Income Statement Analysis – Financial Results
Complete financial analysis of Banca Monte dei Paschi di Siena S.p.A. (BMDPF) income statement, including revenue, profit margins, EPS and key performance metrics. Get detailed insights into the financial performance of Banca Monte dei Paschi di Siena S.p.A., a leading company in the Banks – Regional industry within the Financial Services sector.
- Thinking Electronic Industrial Co., Ltd. (2428.TW) Income Statement Analysis – Financial Results
- Octopus Biosafety SA (MLOCT.PA) Income Statement Analysis – Financial Results
- AIXTRON SE (AIXA.DE) Income Statement Analysis – Financial Results
- TradeUP Global Corporation (TUGCU) Income Statement Analysis – Financial Results
- Infinity Bancorp (INFT) Income Statement Analysis – Financial Results
Banca Monte dei Paschi di Siena S.p.A. (BMDPF)
About Banca Monte dei Paschi di Siena S.p.A.
Banca Monte dei Paschi di Siena S.p.A. provides retail and commercial banking services primarily in Italy. The company operates through Retail Banking, Corporate Banking, and Wealth Management segments. It offers funding and lending services, insurance products, financial advisory, and electronic payment services; financial and non-financial services; wealth management and financial planning services; consultancy services, such as tax planning, real estate, art, and legal advisory; fiduciary and trust services; and digital banking services. The company also provides leasing and factoring services for businesses, artisans, and professionals; and medium-and long-term credit facilities, corporate finance, capital markets, and structured finance services. In addition, it offers investment banking products and services; foreign banking services; and custody and deposit services for dairy products on behalf of third parties. Further, the company develops and manages ICT and telecommunication systems. As of December 31, 2021, it operated a network of 1,368 branches, 126 specialized centers, and 2,621 ATM machines in Italy; 1 operational branch in Shanghai; and 8 representative offices in the areas of Europe, North Africa, India, and China. The company was founded in 1472 and is headquartered in Siena, Italy.
| Metric | 2023 | 2022 | 2021 | 2020 | 2019 | 2018 | 2017 | 2016 | 2015 | 2014 | 2013 | 2012 | 2011 | 2010 | 2009 | 2008 | 2007 | 2006 | 2005 | 2004 |
|---|---|---|---|---|---|---|---|---|---|---|---|---|---|---|---|---|---|---|---|---|
| Revenue | 3.36B | 3.29B | 3.18B | 3.17B | 3.54B | 3.65B | 4.79B | 4.69B | 5.52B | 4.61B | 4.21B | 5.01B | 5.58B | 6.04B | 5.76B | 4.12B | 5.16B | 4.99B | 8.20B | 8.13B |
| Cost of Revenue | -430.12M | 0.00 | 0.00 | 0.00 | 0.00 | 0.00 | 0.00 | 0.00 | 0.00 | 0.00 | 0.00 | 0.00 | 0.00 | 0.00 | 0.00 | 0.00 | 0.00 | 0.00 | 0.00 | 0.00 |
| Gross Profit | 3.79B | 3.29B | 3.18B | 3.17B | 3.54B | 3.65B | 4.79B | 4.69B | 5.52B | 4.61B | 4.21B | 5.01B | 5.58B | 6.04B | 5.76B | 4.12B | 5.16B | 4.99B | 8.20B | 8.13B |
| Gross Profit Ratio | 112.79% | 100.00% | 100.00% | 100.00% | 100.00% | 100.00% | 100.00% | 100.00% | 100.00% | 100.00% | 100.00% | 100.00% | 100.00% | 100.00% | 100.00% | 100.00% | 100.00% | 100.00% | 100.00% | 100.00% |
| Research & Development | 0.00 | 0.00 | 0.00 | 0.00 | 0.00 | 0.00 | 0.00 | 0.00 | 0.00 | 0.00 | 0.00 | 0.00 | 0.00 | 0.00 | 0.00 | 0.00 | 0.00 | 0.00 | 0.00 | 0.00 |
| General & Administrative | 517.59M | 567.12M | 541.49M | 1.03B | 1.05B | 1.13B | 1.21B | 1.45B | 1.31B | 1.14B | 1.23B | 1.38B | 1.40B | 1.38B | 1.51B | 1.34B | 1.19B | 1.10B | 1.16B | 1.09B |
| Selling & Marketing | 6.32M | 3.14M | 3.46M | 5.45M | 5.09M | 5.86M | 12.49M | 5.54M | 6.99M | 13.75M | 18.64M | 42.67M | 57.69M | 0.00 | 0.00 | 0.00 | 0.00 | 0.00 | 0.00 | 0.00 |
| SG&A | 1.93B | 570.26M | 544.95M | 1.03B | 1.05B | 1.13B | 1.21B | 1.45B | 1.31B | 1.14B | 1.23B | 1.38B | 1.40B | 1.38B | 1.51B | 1.34B | 1.19B | 1.10B | 1.16B | 1.09B |
| Other Expenses | 0.00 | -1.03B | -1.03B | -1.11B | -1.20B | -1.25B | -1.39B | -1.35B | -1.41B | 0.00 | 0.00 | 0.00 | 0.00 | 0.00 | 138.34M | 173.49M | 141.39M | 2.91M | 4.61M | 29.17M |
| Operating Expenses | 1.93B | 3.46B | 2.73B | 3.88B | 2.98B | 3.23B | 3.88B | 3.36B | 3.33B | 3.35B | 3.53B | 3.94B | 4.24B | 4.00B | 4.12B | 3.17B | 3.34B | 3.10B | 7.11B | 7.37B |
| Cost & Expenses | 1.93B | 3.46B | 2.73B | 3.88B | 2.98B | 3.23B | 3.88B | 3.36B | 3.33B | 3.35B | 3.53B | 3.94B | 4.24B | 4.00B | 4.12B | 3.17B | 3.34B | 3.10B | 7.11B | 7.37B |
| Interest Income | 4.36B | 2.15B | 1.90B | 1.98B | 2.11B | 2.33B | 2.70B | 3.32B | 4.09B | 5.21B | 5.99B | 6.71B | 7.34B | 6.47B | 7.10B | 8.50B | 7.38B | 5.88B | 5.24B | 4.79B |
| Interest Expense | 2.07B | 614.49M | 680.34M | 703.66M | 615.48M | 608.68M | 927.58M | 1.32B | 1.86B | 3.08B | 3.87B | 3.93B | 3.93B | 2.93B | 3.42B | 6.07B | 4.46B | 3.11B | 2.24B | 2.09B |
| Depreciation & Amortization | 181.08M | 187.47M | 201.65M | 236.13M | 281.22M | 273.19M | 288.09M | 252.48M | 246.41M | 238.29M | 195.18M | 248.61M | 249.86M | 285.27M | 268.01M | 103.34M | 131.04M | 146.70M | 150.43M | 224.38M |
| EBITDA | 0.00 | 0.00 | 0.00 | 0.00 | 0.00 | 0.00 | 0.00 | 0.00 | 0.00 | 0.00 | 0.00 | 0.00 | 0.00 | 0.00 | 0.00 | 0.00 | 0.00 | 0.00 | 0.00 | 0.00 |
| EBITDA Ratio | 0.00% | -13.34% | 14.56% | -35.10% | 8.63% | 2.95% | -83.06% | -63.63% | 11.37% | -161.41% | -45.47% | -67.55% | -79.86% | 26.69% | 9.00% | 4.10% | 41.11% | 31.23% | 15.19% | 12.49% |
| Operating Income | 1.43B | -631.32M | 258.34M | -1.35B | 35.66M | -142.54M | -4.22B | -3.24B | 380.82M | -7.68B | -2.11B | -3.63B | -4.71B | 1.33B | 250.62M | 65.48M | 1.99B | 1.41B | 1.10B | 791.10M |
| Operating Income Ratio | 42.62% | -19.20% | 8.11% | -42.59% | 1.01% | -3.90% | -88.23% | -69.02% | 6.90% | -166.58% | -50.10% | -72.50% | -84.34% | 21.97% | 4.35% | 1.59% | 38.57% | 28.29% | 13.36% | 9.73% |
| Total Other Income/Expenses | 272.68M | -109.76M | -207.92M | -1.15B | 17.93M | -76.80M | 76.04M | -36.48M | 0.00 | -664.07M | 111.00M | 76.59M | -4.52B | 0.00 | 138.34M | 22.63M | -1.22B | 17.65M | -266.81M | 29.17M |
| Income Before Tax | 1.71B | -631.47M | 258.16M | -1.35B | 53.59M | -76.80M | -4.22B | -3.23B | 382.59M | -7.68B | -2.06B | -3.67B | -4.73B | 1.33B | 43.43M | 65.48M | 1.27B | 1.29B | 1.10B | 791.10M |
| Income Before Tax Ratio | 50.73% | -19.21% | 8.11% | -42.59% | 1.51% | -2.10% | -88.23% | -68.81% | 6.94% | -166.67% | -48.88% | -73.15% | -84.72% | 21.97% | 0.75% | 1.59% | 24.62% | 25.83% | 13.36% | 9.73% |
| Income Tax Expense | -345.12M | -426.62M | -51.17M | 338.20M | 1.07B | -421.12M | -722.15M | 5.19M | -7.28M | -2.34B | -671.88M | -464.53M | -23.35M | 341.85M | 30.51M | -1.16B | 551.59M | 501.44M | 281.54M | 178.57M |
| Net Income | 2.05B | -204.70M | 309.51M | -1.69B | -1.03B | 278.58M | -3.50B | -3.24B | 388.10M | -5.34B | -1.44B | -3.17B | -4.69B | 985.50M | 181.56M | 1.22B | 1.44B | 734.12M | 813.66M | 599.42M |
| Net Income Ratio | 60.99% | -6.23% | 9.72% | -53.25% | -29.17% | 7.62% | -73.15% | -69.13% | 7.04% | -115.89% | -34.15% | -63.24% | -83.92% | 16.31% | 3.15% | 29.70% | 27.88% | 14.71% | 9.93% | 7.37% |
| EPS | 1.63 | -0.20 | 6.54 | -32.22 | -19.50 | 5.26 | -152.10 | -2.30K | 465.25 | -82.72K | -1.05K | -14.65K | -30.51K | 9.42K | 1.48K | 13.06K | 26.41K | 13.48K | 14.95K | 8.96K |
| EPS Diluted | 1.63 | -0.20 | 6.54 | -32.22 | -19.50 | 5.26 | -152.10 | -2.30K | 457.69 | -82.72K | -1.05K | -14.65K | -30.51K | 6.84K | 1.48K | 12.30K | 26.41K | 12.63K | 13.54K | 8.06K |
| Weighted Avg Shares Out | 1.26B | 1.01B | 47.32M | 52.42M | 52.98M | 52.98M | 23.03M | 1.41M | 834.15K | 64.59K | 1.37M | 216.34K | 153.58K | 104.58K | 123.24K | 93.67K | 54.43K | 54.53K | 54.41K | 66.93K |
| Weighted Avg Shares Out (Dil) | 1.26B | 1.01B | 47.32M | 52.42M | 52.98M | 52.98M | 23.03M | 1.41M | 847.99K | 64.59K | 1.37M | 216.34K | 153.58K | 144.05K | 123.58K | 99.48K | 54.43K | 59.47K | 60.09K | 74.37K |
Monte dei Paschi kicks off 2.5 bln euro cash call
Factbox: Companies potentially affected by Italy's election
Monte dei Paschi could raise needed cash in steps - paper
Monte dei Paschi posts quarterly profit as it works to cut bad loans

Monte dei Paschi seals deal with unions over exit of 3,500 staff
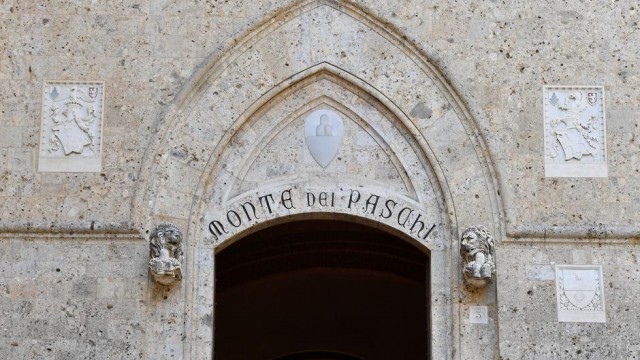
Decline and near fall of Italy's Monte dei Paschi, the world's oldest bank
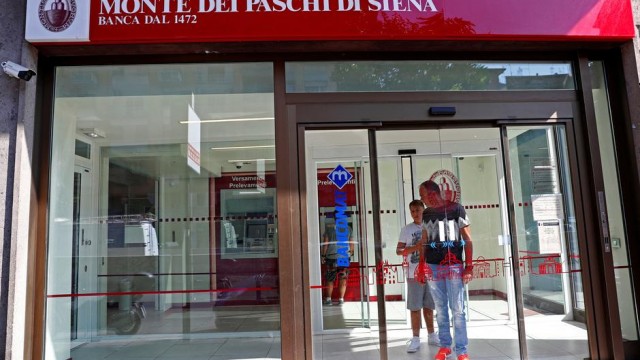
Monte dei Paschi plans to raise 2.5 billion euros for latest turnaround plan
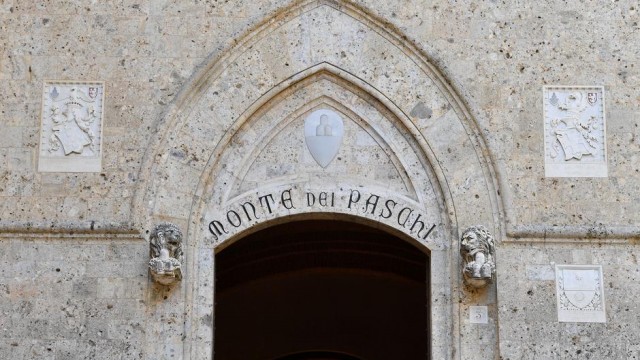
Italy sees EU nod over Monte dei Paschi nearing - sources
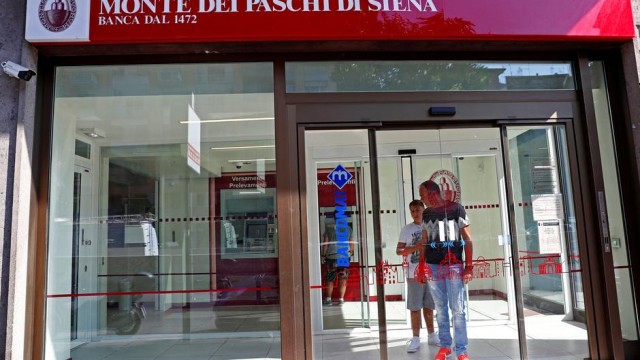
Monte dei Paschi names veteran UniCredit executive as CFO
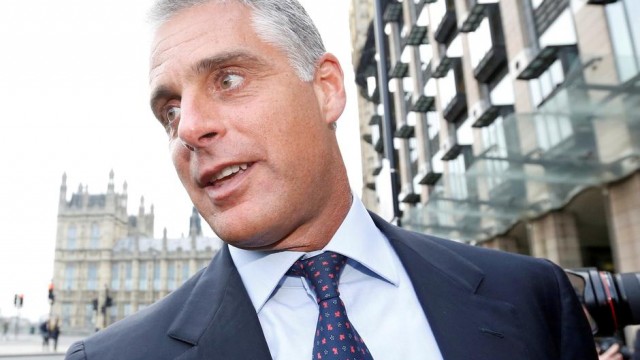
UniCredit CEO rules out reopening of Monte dei Paschi talks
Source: https://incomestatements.info
Category: Stock Reports
