See more : Newegg Commerce, Inc. (NEGG) Income Statement Analysis – Financial Results
Complete financial analysis of BowX Acquisition Corp. (BOWX) income statement, including revenue, profit margins, EPS and key performance metrics. Get detailed insights into the financial performance of BowX Acquisition Corp., a leading company in the Shell Companies industry within the Financial Services sector.
- Astro Malaysia Holdings Berhad (6399.KL) Income Statement Analysis – Financial Results
- Provident Acquisition Corp. (PAQCU) Income Statement Analysis – Financial Results
- Guilin Tourism Corporation Limited (000978.SZ) Income Statement Analysis – Financial Results
- Cerence Inc. (0S6.DE) Income Statement Analysis – Financial Results
- Bayerische Motoren Werke Aktiengesellschaft (BYMOF) Income Statement Analysis – Financial Results
BowX Acquisition Corp. (BOWX)
About BowX Acquisition Corp.
Bowx Acquisition Corp. intends to effect a merger, capital stock exchange, asset acquisition, stock purchase, reorganization, or related business combination with one or more businesses. It primarily focuses on businesses in the technology, media, and telecommunications industries. The company was founded in 2020 and is based in Menlo Park, California.
| Metric | 2022 | 2021 | 2020 | 2019 |
|---|---|---|---|---|
| Revenue | 3.25B | 2.57B | 3.42B | 3.46B |
| Cost of Revenue | 2.91B | 3.09B | 3.54B | 2.76B |
| Gross Profit | 331.00M | -515.00M | -127.00M | 700.27M |
| Gross Profit Ratio | 10.20% | -20.04% | -3.72% | 20.25% |
| Research & Development | 0.00 | 0.00 | 0.00 | 0.00 |
| General & Administrative | 698.00M | 968.00M | 1.53B | 2.66B |
| Selling & Marketing | 37.00M | 43.00M | 72.20M | 137.60M |
| SG&A | 735.00M | 1.01B | 1.61B | 2.79B |
| Other Expenses | 0.00 | 0.00 | 0.00 | 0.00 |
| Operating Expenses | 1.50B | 1.88B | 2.66B | 3.96B |
| Cost & Expenses | 4.41B | 4.96B | 6.20B | 6.71B |
| Interest Income | 9.00M | 19.00M | 17.00M | 53.24M |
| Interest Expense | 257.00M | 245.00M | 159.00M | 99.59M |
| Depreciation & Amortization | 641.00M | 709.00M | 779.00M | 589.91M |
| EBITDA | -792.00M | -1.89B | -2.21B | -2.64B |
| EBITDA Ratio | -24.41% | -73.70% | -64.55% | -76.46% |
| Operating Income | -1.59B | -3.70B | -4.35B | -3.92B |
| Operating Income Ratio | -49.03% | -143.89% | -127.25% | -113.33% |
| Total Other Income/Expenses | -698.00M | -2.24B | -1.03B | -486.24M |
| Income Before Tax | -2.29B | -4.63B | -3.81B | -3.73B |
| Income Before Tax Ratio | -70.54% | -180.12% | -111.65% | -107.83% |
| Income Tax Expense | 6.00M | 3.00M | 20.00M | 45.64M |
| Net Income | -2.03B | -4.44B | -3.13B | -3.26B |
| Net Income Ratio | -62.68% | -172.72% | -91.60% | -94.40% |
| EPS | -106.79 | -673.63 | -179.70 | -187.50 |
| EPS Diluted | -106.79 | -673.63 | -179.70 | -187.50 |
| Weighted Avg Shares Out | 19.05M | 6.59M | 17.41M | 17.41M |
| Weighted Avg Shares Out (Dil) | 19.05M | 6.59M | 17.41M | 17.41M |

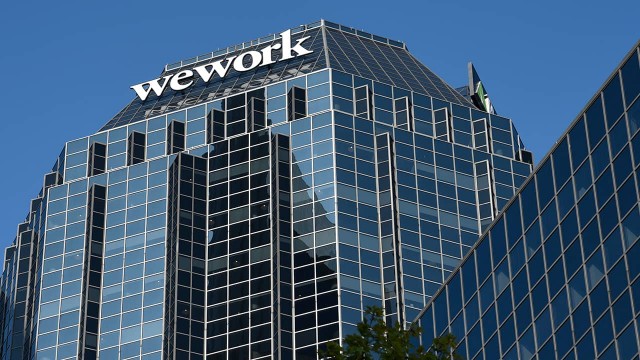
WeWork: An Intriguing Investment For A Post-COVID Workforce

Recruiter.com partners with WeWork to expand its on-demand talent recruitment services

Why WeWork Partnered With Coinbase

WeWork Will Now Accept Cryptocurrency Payments

WeWork to begin accepting cryptocurrency for payments

WeWork's new stock-listing plan has echoes of its past

The Wall Street Journal: WeWork's new push to go public hasn't eased regulators' concerns

8 Major Players in the SPAC Game to Watch

3 Stocks to Avoid This Week

SHAREHOLDER ALERT: Monteverde & Associates PC Announces an Investigation of BowX Acquisition Corp. - BOWX
Source: https://incomestatements.info
Category: Stock Reports
