See more : Strategic Energy Resources Limited (SER.AX) Income Statement Analysis – Financial Results
Complete financial analysis of Bird Global, Inc. (BRDS) income statement, including revenue, profit margins, EPS and key performance metrics. Get detailed insights into the financial performance of Bird Global, Inc., a leading company in the Rental & Leasing Services industry within the Industrials sector.
- AvalonBay Communities, Inc. (AVB) Income Statement Analysis – Financial Results
- Muhak Co., Ltd. (033920.KS) Income Statement Analysis – Financial Results
- Metalex Ventures Ltd. (MTX.V) Income Statement Analysis – Financial Results
- KeyStar Corp. (KEYR) Income Statement Analysis – Financial Results
- National Grid plc (NGG) Income Statement Analysis – Financial Results
Bird Global, Inc. (BRDS)
About Bird Global, Inc.
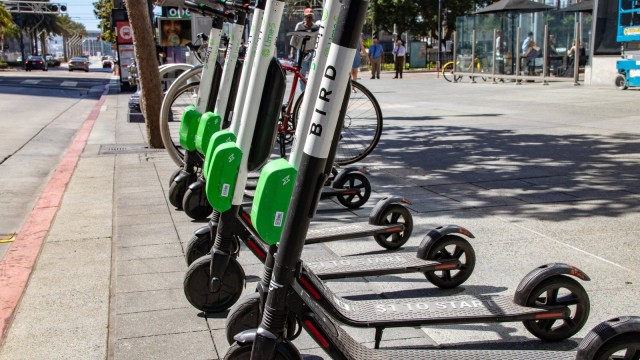
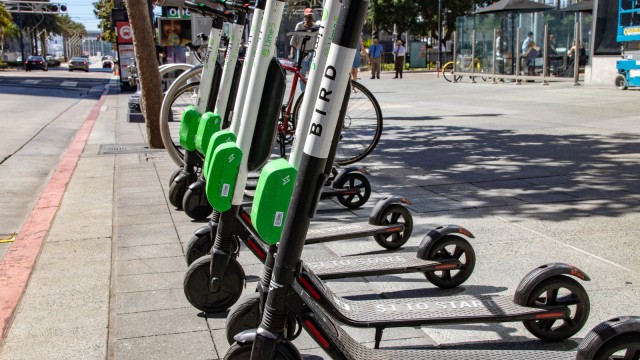
Bird Global, Inc., a micromobility company, engages in delivering electric transportation solutions for short distances. Its sharing vehicles include e-scooters and e-bikes. The company offers a fleet of shared micro electric vehicles to riders through bird.co, as well as sells vehicles to distributors, retailers, and direct customers. Bird Global, Inc. was founded in 2017 and is headquartered in Miami, Florida.
| Metric | 2022 | 2021 | 2020 | 2019 |
|---|---|---|---|---|
| Revenue | 244.66M | 205.14M | 90.11M | 150.52M |
| Cost of Revenue | 209.96M | 165.74M | 115.99M | 286.20M |
| Gross Profit | 34.71M | 39.41M | -25.89M | -135.68M |
| Gross Profit Ratio | 14.18% | 19.21% | -28.73% | -90.14% |
| Research & Development | 40.11M | 31.43M | 34.38M | 40.84M |
| General & Administrative | 233.81M | 210.00M | 154.37M | 192.06M |
| Selling & Marketing | 16.32M | 17.91M | 18.40M | 16.66M |
| SG&A | 250.13M | 227.90M | 172.78M | 208.72M |
| Other Expenses | 125.40M | 29.87M | 5.95M | 2.98M |
| Operating Expenses | 290.24M | 259.33M | 207.15M | 249.56M |
| Cost & Expenses | 500.19M | 425.07M | 323.14M | 535.75M |
| Interest Income | 0.00 | 0.00 | 0.00 | 0.00 |
| Interest Expense | 10.77M | 6.07M | 6.56M | 4.96M |
| Depreciation & Amortization | 187.11M | 81.47M | 13.46M | 119.93M |
| EBITDA | -68.42M | -157.05M | -194.60M | -265.30M |
| EBITDA Ratio | -27.97% | -67.49% | -215.97% | -176.25% |
| Operating Income | -255.53M | -219.92M | -208.05M | -385.23M |
| Operating Income Ratio | -104.44% | -107.21% | -230.90% | -255.93% |
| Total Other Income/Expenses | -101.20M | 39.08M | -616.00K | -1.98M |
| Income Before Tax | -356.73M | -196.12M | -208.67M | -387.21M |
| Income Before Tax Ratio | -145.81% | -95.60% | -231.58% | -257.24% |
| Income Tax Expense | 2.01M | 209.00K | 64.00K | 276.00K |
| Net Income | -358.74M | -196.33M | -208.73M | -387.48M |
| Net Income Ratio | -146.63% | -95.71% | -231.66% | -257.42% |
| EPS | -1.32 | -18.00 | -19.02 | -35.31 |
| EPS Diluted | -1.32 | -18.00 | -19.02 | -35.31 |
| Weighted Avg Shares Out | 272.62M | 10.90M | 10.97M | 10.97M |
| Weighted Avg Shares Out (Dil) | 272.62M | 10.90M | 10.97M | 10.97M |

Bird Secures Renewals for Micromobility Operations in Nearly 30 Markets Across United States, Including Major Cities

BRDS Stock Alert: What to Know as Bird Global Leadership Buys Shares

Why cities continue to have a love-hate affair with e-scooters

Using Fundamental Analysis to Find Penny Stocks to Buy

The Impact of Institutional Investors on Penny Stocks

Using Volatility and Volume to Make Money With Penny Stocks

Why Am I Losing Money With Penny Stocks? 3 Reasons

Why Is Bird Global (BRDS) Stock Up 19% Today?

Bird Global, Inc. (BRDS) Q4 2022 Earnings Call Transcript

6 Penny Stocks to Sell Right Now
Source: https://incomestatements.info
Category: Stock Reports
