See more : Banco Bilbao Vizcaya Argentaria, S.A. (BBVA.MC) Income Statement Analysis – Financial Results
Complete financial analysis of BioSig Technologies, Inc. (BSGM) income statement, including revenue, profit margins, EPS and key performance metrics. Get detailed insights into the financial performance of BioSig Technologies, Inc., a leading company in the Medical – Devices industry within the Healthcare sector.
- Quipt Home Medical Corp. (QIPT) Income Statement Analysis – Financial Results
- The Investment Company plc (INV.L) Income Statement Analysis – Financial Results
- MEMSCAP, S.A. (MEMS.PA) Income Statement Analysis – Financial Results
- OMV Aktiengesellschaft (OMVKY) Income Statement Analysis – Financial Results
- Inventiva S.A. (0RNK.L) Income Statement Analysis – Financial Results
BioSig Technologies, Inc. (BSGM)
About BioSig Technologies, Inc.
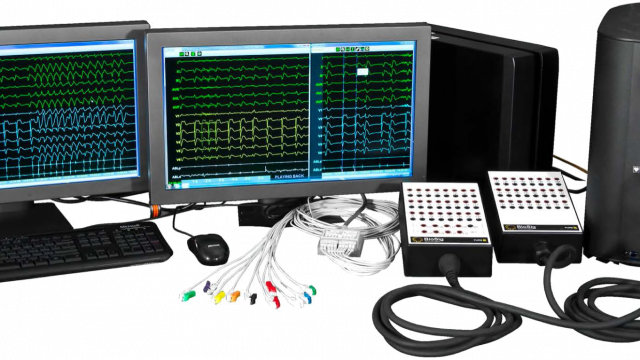
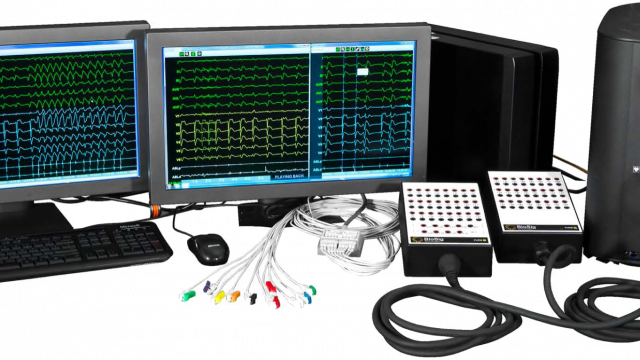
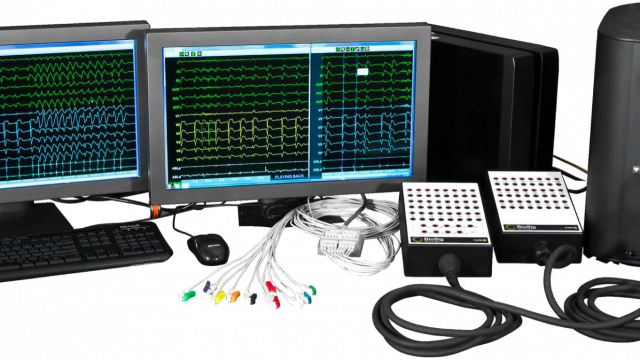
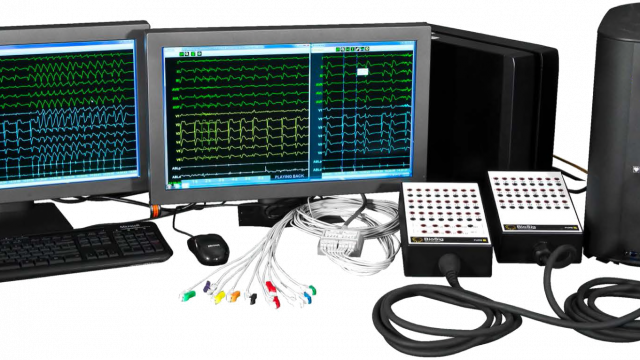
BioSig Technologies, Inc., together with its subsidiaries, operates as medical device company. The company's proprietary product includes precise uninterrupted real-time evaluation of electrograms electrophysiology (PURE EP) system, a signal processing platform that combines hardware and software to address known challenges associated to signal acquisition that enables electrophysiologists to see signals and analyze in real-time. It also focuses on enhancing intracardiac signal acquisition and diagnostic information for the procedures of atrial fibrillation, as well as is designed to address long-standing limitations that slow and disrupt cardiac catheter ablation procedures. The company has a research agreement with University of Minnesota to develop novel therapies to treat sympathetic nervous system diseases; and a strategic collaboration with the Mayo Foundation for Medical Education and Research to develop an AI-and machine learning software solution for PURE EP systems. BioSig Technologies, Inc. was incorporated in 2009 and is headquartered in Westport, Connecticut.
| Metric | 2023 | 2022 | 2021 | 2020 | 2019 | 2018 | 2017 | 2016 | 2015 | 2014 | 2013 | 2012 | 2011 |
|---|---|---|---|---|---|---|---|---|---|---|---|---|---|
| Revenue | 18.00K | 286.00K | 441.00K | 0.00 | 0.00 | 0.00 | 0.00 | 0.00 | 0.00 | 0.00 | 0.00 | 0.00 | 0.00 |
| Cost of Revenue | 0.00 | 57.00K | 199.00K | 550.00K | 54.35K | 12.40K | 11.70K | 10.48K | 10.48K | 0.00 | 0.00 | 0.00 | 6.80K |
| Gross Profit | 18.00K | 229.00K | 242.00K | -550.00K | -54.35K | -12.40K | -11.70K | -10.48K | -10.48K | 0.00 | 0.00 | 0.00 | -6.80K |
| Gross Profit Ratio | 100.00% | 80.07% | 54.88% | 0.00% | 0.00% | 0.00% | 0.00% | 0.00% | 0.00% | 0.00% | 0.00% | 0.00% | 0.00% |
| Research & Development | 5.09M | 5.82M | 5.60M | 18.14M | 9.74M | 4.37M | 4.76M | 2.65M | 1.24M | 548.00K | 992.21K | 888.95K | 582.53K |
| General & Administrative | 23.08M | 21.38M | 27.85M | 40.95M | 24.81M | 12.88M | 8.14M | 8.50M | 10.80M | 7.30M | 5.23M | 1.29M | 0.00 |
| Selling & Marketing | 0.00 | 0.00 | 0.00 | 0.00 | 0.00 | 0.00 | 0.00 | 0.00 | 0.00 | 0.00 | 0.00 | 72.41K | 0.00 |
| SG&A | 23.08M | 21.38M | 27.85M | 40.95M | 24.81M | 12.88M | 8.14M | 8.50M | 10.80M | 7.30M | 5.23M | 1.36M | 484.13K |
| Other Expenses | 361.00K | 293.00K | 198.00K | 94.00K | 54.35K | 12.40K | 11.70K | 10.48K | 10.48K | 15.81K | 17.06K | 0.00 | 0.00 |
| Operating Expenses | 28.53M | 27.49M | 33.65M | 59.18M | 34.60M | 17.26M | 12.91M | 11.16M | 12.04M | 7.87M | 6.24M | 2.26M | 1.07M |
| Cost & Expenses | 28.53M | 27.55M | 33.85M | 59.18M | 34.60M | 17.26M | 12.91M | 11.16M | 12.04M | 7.87M | 6.24M | 2.26M | 1.07M |
| Interest Income | 9.00K | 3.00K | 2.00K | 45.00K | 132.75K | 10.90K | 75.00 | 1.00 | 1.30K | 11.03K | 70.06K | 124.17K | 171.00 |
| Interest Expense | 0.00 | 0.00 | 0.00 | 0.00 | 0.00 | 10.90K | 75.00 | 1.00 | 0.00 | 0.00 | 0.00 | 0.00 | 0.00 |
| Depreciation & Amortization | 361.00K | 666.00K | 639.00K | 550.00K | 54.35K | 12.40K | 11.70K | 10.48K | 10.48K | 15.81K | 17.06K | 10.02K | 6.80K |
| EBITDA | -28.15M | -26.97M | -33.21M | -58.63M | -34.42M | -17.25M | -13.11M | -10.73M | -9.45M | -7.85M | -6.22M | -2.25M | -1.14M |
| EBITDA Ratio | -156,394.44% | -9,430.77% | -7,656.69% | 0.00% | 0.00% | 0.00% | 0.00% | 0.00% | 0.00% | 0.00% | 0.00% | 0.00% | 0.00% |
| Operating Income | -28.51M | -27.27M | -33.41M | -59.18M | -34.60M | -17.26M | -12.91M | -11.16M | -12.04M | -7.87M | -6.24M | -2.26M | -1.07M |
| Operating Income Ratio | -158,400.00% | -9,533.22% | -7,576.19% | 0.00% | 0.00% | 0.00% | 0.00% | 0.00% | 0.00% | 0.00% | 0.00% | 0.00% | 0.00% |
| Total Other Income/Expenses | -178.00K | 3.00K | 555.00K | 44.00K | 133.20K | 10.90K | 210.54K | -422.91K | 2.58M | -604.80K | -3.57M | -124.17K | -77.76K |
| Income Before Tax | -28.69M | -27.26M | -32.86M | -59.14M | -34.47M | -17.25M | -12.70M | -11.59M | -9.46M | -8.47M | -9.80M | -2.39M | -1.15M |
| Income Before Tax Ratio | -159,388.89% | -9,532.17% | -7,450.34% | 0.00% | 0.00% | 0.00% | 0.00% | 0.00% | 0.00% | 0.00% | 0.00% | 0.00% | 0.00% |
| Income Tax Expense | 0.00 | 9.00K | -1.49M | -6.97M | -549.05K | 21.79K | -210.54K | 422.91K | -2.58M | 11.03K | 70.06K | 90.86K | 0.00 |
| Net Income | -29.04M | -27.27M | -31.36M | -52.17M | -33.92M | -17.25M | -12.70M | -11.59M | -9.46M | -8.47M | -9.80M | -2.48M | -1.15M |
| Net Income Ratio | -161,338.89% | -9,535.31% | -7,111.56% | 0.00% | 0.00% | 0.00% | 0.00% | 0.00% | 0.00% | 0.00% | 0.00% | 0.00% | 0.00% |
| EPS | -3.95 | -6.33 | -9.36 | -18.70 | -16.39 | -11.89 | -12.42 | -14.86 | -16.77 | -21.95 | -29.94 | -0.76 | -4.43 |
| EPS Diluted | -3.95 | -6.33 | -9.36 | -18.70 | -16.39 | -11.89 | -12.42 | -14.86 | -16.77 | -21.95 | -29.94 | -0.76 | -4.43 |
| Weighted Avg Shares Out | 7.35M | 4.31M | 3.35M | 2.79M | 2.07M | 1.45M | 1.02M | 779.63K | 564.12K | 386.01K | 327.51K | 3.26M | 266.00K |
| Weighted Avg Shares Out (Dil) | 7.35M | 4.31M | 3.35M | 2.79M | 2.07M | 1.45M | 1.02M | 779.63K | 564.12K | 386.01K | 327.51K | 3.26M | 266.00K |

BioSig Technologies enters deal for Cleveland Clinic to evaluate its PURE EP signal processing platform

BioSig: PURE EP Economics Trade Exhausted

BioSig targets July 1 to launch national PURE EP commercial campaign

BioSig Advances its PURE™ System Commercial Launch to Medical Centers Nationwide

BioSig's PURE EP™ System to be Featured During EPLive 2022

BioSig maintains ‘Outperform' rating from Noble Capital as "stronger commercialization efforts” underway for its PURE EP system

BioSig Technologies CEO Kenneth Londoner says the company has made great strides as it accelerates commercial momentum for its PURE EP system

BioSig Technologies, Inc. Issues Shareholder Letter with Corporate Update on Recent Achievements

BioSig to Present at Heart Rhythm 2022

BioSig to Present at NobleCon18 Capital Markets Conference
Source: https://incomestatements.info
Category: Stock Reports
