See more : PETRONAS Dagangan Berhad (5681.KL) Income Statement Analysis – Financial Results
Complete financial analysis of Base Resources Limited (BSRUF) income statement, including revenue, profit margins, EPS and key performance metrics. Get detailed insights into the financial performance of Base Resources Limited, a leading company in the Industrial Materials industry within the Basic Materials sector.
- Iluka Resources Limited (ILKAF) Income Statement Analysis – Financial Results
- Capital Estate Limited (0193.HK) Income Statement Analysis – Financial Results
- Schroder Income Growth Fund plc (SCF.L) Income Statement Analysis – Financial Results
- Investeringsforeningen Investin – I&T Nordiske Aktier Large Cap (INIITNAKTLC.CO) Income Statement Analysis – Financial Results
- Shalfa Facilities Management Company (9613.SR) Income Statement Analysis – Financial Results
Base Resources Limited (BSRUF)
About Base Resources Limited
Base Resources Limited operates as mineral sand developer and producer in Africa. It operates through Kwale Operation, Toliara Project, and Other segments. The company produces mineral sands, such as rutile, ilmenite, and zircon. It primarily owns a 100% interest in the Kwale Mineral Sands project located in Kenya; and develops the Toliara project located in Madagascar. The company was formerly known as Base Iron Limited and changed its name to Base Resources Limited in 2010. Base Resources Limited was incorporated in 2007 and is headquartered in West Perth, Australia.
| Metric | 2024 | 2023 | 2022 | 2021 | 2020 | 2019 | 2018 | 2017 | 2016 | 2015 | 2014 | 2013 | 2012 |
|---|---|---|---|---|---|---|---|---|---|---|---|---|---|
| Revenue | 137.44M | 268.75M | 279.12M | 198.24M | 208.02M | 209.46M | 198.81M | 165.60M | 126.24M | 111.60M | 27.41M | 0.00 | 0.00 |
| Cost of Revenue | 99.46M | 121.56M | 131.66M | 139.31M | 139.33M | 131.79M | 119.80M | 106.14M | 99.78M | 87.99M | 24.23M | 0.00 | 0.00 |
| Gross Profit | 37.99M | 147.19M | 147.46M | 58.93M | 68.68M | 77.67M | 79.01M | 59.46M | 26.45M | 23.61M | 3.18M | 0.00 | 0.00 |
| Gross Profit Ratio | 27.64% | 54.77% | 52.83% | 29.72% | 33.02% | 37.08% | 39.74% | 35.91% | 20.95% | 21.15% | 11.60% | 0.00% | 0.00% |
| Research & Development | 1.82M | 395.00K | 1.75M | 526.00K | 0.00 | 0.00 | 0.00 | 2.76M | 2.93M | 3.03M | 0.00 | 0.00 | 0.00 |
| General & Administrative | 20.43M | 14.41M | 12.45M | 12.00M | 10.47M | 10.32M | 9.34M | 8.24M | 8.40M | 8.34M | 8.21M | 3.23M | 2.99M |
| Selling & Marketing | 1.25M | 2.17M | 2.95M | 3.71M | 2.39M | 2.50M | 4.06M | 2.07M | 3.07M | 1.83M | 694.82K | 365.04K | 0.00 |
| SG&A | 21.68M | 24.08M | 2.95M | 3.71M | 2.39M | 2.50M | 4.06M | 2.07M | 3.07M | 1.83M | 694.82K | 3.23M | 2.99M |
| Other Expenses | -1.72M | -1.69M | -2.87M | -2.94M | 314.00K | 201.00K | -765.00K | 0.00 | 0.00 | 0.00 | 0.00 | 0.00 | 0.00 |
| Operating Expenses | 21.68M | 24.08M | 26.46M | 22.59M | 16.41M | 16.42M | 17.16M | 13.31M | 16.46M | 13.37M | 12.24M | 7.00M | 5.47M |
| Cost & Expenses | 121.14M | 145.64M | 158.12M | 161.90M | 155.75M | 148.21M | 136.96M | 119.44M | 116.25M | 101.36M | 36.47M | 7.00M | 5.47M |
| Interest Income | 2.64M | 1.60M | 16.00K | 2.69M | 2.27M | 8.09M | 0.00 | 482.33K | 101.56K | 207.09K | 330.46K | 1.79M | 5.67M |
| Interest Expense | 2.54M | 1.10M | 4.14M | 5.88M | 5.87M | 11.56M | 18.49M | 23.99M | 23.24M | 22.48M | 3.60M | 0.00 | 0.00 |
| Depreciation & Amortization | 14.87M | 37.76M | 38.20M | 59.87M | 59.10M | 51.70M | 45.69M | 39.49M | 35.60M | 31.81M | 8.50M | 87.87K | 36.46K |
| EBITDA | 28.76M | 159.44M | 121.00M | 98.67M | 112.41M | 111.38M | 104.21M | 84.18M | 47.04M | 42.34M | -560.65K | -6.08M | -5.44M |
| EBITDA Ratio | 22.68% | 59.86% | 43.35% | 18.33% | 25.28% | 29.33% | 31.11% | 27.87% | 6.06% | 9.17% | -33.06% | 0.00% | 0.00% |
| Operating Income | 16.31M | 123.11M | 121.00M | 36.34M | -4.14M | 9.56M | 14.50M | 8.06M | -27.50M | -21.57M | -17.56M | -7.00M | -5.07M |
| Operating Income Ratio | 11.86% | 45.81% | 43.35% | 18.33% | -1.99% | 4.56% | 7.29% | 4.87% | -21.78% | -19.33% | -64.08% | 0.00% | 0.00% |
| Total Other Income/Expenses | -1.92M | -93.46M | -16.46M | -15.43M | -6.64M | -11.35M | -19.25M | -23.51M | -25.58M | -22.48M | -4.16M | 950.94K | 5.83M |
| Income Before Tax | 14.39M | 29.65M | 113.85M | 29.26M | 45.63M | 49.89M | 43.36M | 22.16M | -15.59M | -12.24M | -13.16M | -6.08M | 347.39K |
| Income Before Tax Ratio | 10.47% | 11.03% | 40.79% | 14.76% | 21.94% | 23.82% | 21.81% | 13.38% | -12.35% | -10.97% | -48.00% | 0.00% | 0.00% |
| Income Tax Expense | 16.06M | 34.45M | 33.11M | 18.28M | 6.04M | 10.74M | 9.39M | 6.00M | 29.87K | 61.36K | 88.50K | 3.79K | 8.43K |
| Net Income | -1.67M | -4.79M | 80.74M | 10.98M | 39.59M | 39.15M | 33.97M | 15.85M | -15.62M | -12.30M | -13.25M | -6.08M | 338.96K |
| Net Income Ratio | -1.22% | -1.78% | 28.93% | 5.54% | 19.03% | 18.69% | 17.09% | 9.57% | -12.38% | -11.02% | -48.33% | 0.00% | 0.00% |
| EPS | 0.00 | 0.00 | 0.07 | 0.01 | 0.03 | 0.03 | 0.03 | 0.02 | -0.02 | -0.02 | -0.02 | -0.01 | 0.00 |
| EPS Diluted | 0.00 | 0.00 | 0.06 | 0.01 | 0.03 | 0.03 | 0.03 | 0.02 | -0.02 | -0.02 | -0.02 | -0.01 | 0.00 |
| Weighted Avg Shares Out | 1.17B | 1.16B | 1.17B | 1.17B | 1.17B | 1.16B | 986.98M | 769.47M | 639.34M | 625.39M | 625.43M | 592.19M | 453.74M |
| Weighted Avg Shares Out (Dil) | 1.17B | 1.16B | 1.19B | 1.20B | 1.19B | 1.17B | 986.98M | 833.83M | 639.34M | 625.39M | 625.43M | 592.19M | 464.30M |
Energy Fuels: Optimistic Overlook Despite Small Profitability Hiccup
Base Resources confirms special dividend as merger nears
Base Resources says Toliera draft MoU well-advanced

Base Resources almost doubles on merger with US group

Base Resources almost doubles on merger with US group
Base Resources chair cheers operational and financial success

Base Resources provides update as Kwale transitions to campaign processing
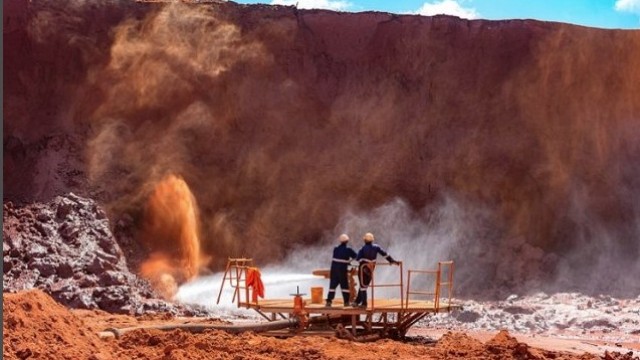
Base Resources to stop Kwale operations at end of 2024

Base Resources dividend gets mixed response

Base Resources' cash climbs after strong operational year
Source: https://incomestatements.info
Category: Stock Reports
