See more : Shemaroo Entertainment Limited (SHEMAROO.NS) Income Statement Analysis – Financial Results
Complete financial analysis of Anheuser-Busch InBev SA/NV (BUD) income statement, including revenue, profit margins, EPS and key performance metrics. Get detailed insights into the financial performance of Anheuser-Busch InBev SA/NV, a leading company in the Beverages – Alcoholic industry within the Consumer Defensive sector.
- Retailors Ltd (RTLS.TA) Income Statement Analysis – Financial Results
- Döhler S.A. (DOHL4.SA) Income Statement Analysis – Financial Results
- Avalon Holdings Corporation (AWX) Income Statement Analysis – Financial Results
- KEPCO Plant Service & Engineering Co.,Ltd. (051600.KS) Income Statement Analysis – Financial Results
- Melrose Industries PLC (MLSPF) Income Statement Analysis – Financial Results
Anheuser-Busch InBev SA/NV (BUD)
About Anheuser-Busch InBev SA/NV
Anheuser-Busch InBev SA/NV engages in the production, distribution, and sale of beer, alcoholic beverages, and soft drinks worldwide. It offers a portfolio of approximately 500 beer brands, which primarily include Budweiser, Corona, and Stella Artois; Beck's, Hoegaarden, Leffe, and Michelob Ultra; and Aguila, Antarctica, Bud Light, Brahma, Cass, Castle, Castle Lite, Cristal, Harbin, Jupiler, Modelo Especial, Quilmes, Victoria, Sedrin, and Skol brands. The company was founded in 1366 and is headquartered in Leuven, Belgium.
| Metric | 2023 | 2022 | 2021 | 2020 | 2019 | 2018 | 2017 | 2016 | 2015 | 2014 | 2013 | 2012 | 2011 | 2010 | 2009 | 2008 | 2007 | 2006 | 2005 | 2004 | 2003 | 2002 |
|---|---|---|---|---|---|---|---|---|---|---|---|---|---|---|---|---|---|---|---|---|---|---|
| Revenue | 59.38B | 57.79B | 54.30B | 46.88B | 52.33B | 54.62B | 56.44B | 45.52B | 43.60B | 47.06B | 43.20B | 39.76B | 39.05B | 36.30B | 36.76B | 23.51B | 21.04B | 17.56B | 13.81B | 11.61B | 8.87B | 7.34B |
| Cost of Revenue | 27.40B | 26.31B | 23.10B | 19.63B | 20.36B | 20.36B | 21.39B | 17.80B | 17.14B | 18.76B | 17.59B | 16.45B | 16.63B | 16.15B | 17.20B | 10.34B | 8.65B | 7.23B | 6.02B | 5.42B | 4.26B | 3.59B |
| Gross Profit | 31.98B | 31.48B | 31.21B | 27.25B | 31.97B | 34.26B | 35.06B | 27.71B | 26.47B | 28.31B | 25.60B | 23.31B | 22.41B | 20.15B | 19.56B | 13.17B | 12.38B | 10.34B | 7.79B | 6.20B | 4.61B | 3.75B |
| Gross Profit Ratio | 53.86% | 54.48% | 57.47% | 58.12% | 61.09% | 62.73% | 62.11% | 60.89% | 60.70% | 60.15% | 59.27% | 58.63% | 57.40% | 55.50% | 53.21% | 56.03% | 58.86% | 58.84% | 56.40% | 53.36% | 51.94% | 51.12% |
| Research & Development | 256.00M | 268.00M | 298.00M | 296.00M | 291.00M | 276.00M | 276.00M | 244.00M | 207.00M | 217.00M | 185.00M | 182.00M | 0.00 | 0.00 | 0.00 | 0.00 | 0.00 | 0.00 | 0.00 | 0.00 | 0.00 | 0.00 |
| General & Administrative | 4.74B | 4.41B | 4.39B | 3.40B | 3.55B | 3.47B | 3.84B | 2.88B | 2.56B | 2.79B | 2.54B | 2.19B | 2.04B | 4.87B | 4.98B | 4.20B | 1.44B | 1.44B | 1.11B | 986.88M | 774.53M | 622.27M |
| Selling & Marketing | 13.44B | 13.14B | 13.18B | 11.97B | 12.87B | 13.65B | 14.26B | 12.29B | 11.17B | 11.59B | 10.02B | 9.04B | 8.46B | 4.71B | 4.99B | 3.51B | 5.57B | 4.84B | 3.92B | 3.38B | 2.71B | 2.18B |
| SG&A | 18.17B | 17.56B | 17.58B | 15.37B | 16.42B | 17.12B | 18.10B | 15.17B | 13.73B | 14.39B | 12.56B | 11.23B | 10.50B | 9.59B | 9.97B | 7.71B | 7.02B | 6.28B | 5.03B | 4.37B | 3.49B | 2.80B |
| Other Expenses | -411.00M | -338.00M | -346.00M | -845.00M | -221.00M | 249.00M | 235.00M | 248.00M | 302.00M | 573.00M | 420.00M | 81.00M | -694.00M | -588.00M | -2.14B | -339.00M | -956.45M | -260.00M | -156.34M | 50.16M | 62.97M | 186.78M |
| Operating Expenses | 18.02B | 17.22B | 17.23B | 14.52B | 16.20B | 17.11B | 17.70B | 14.79B | 13.08B | 13.61B | 11.90B | 10.72B | 9.81B | 9.00B | 9.31B | 7.37B | 6.06B | 6.02B | 4.88B | 4.42B | 3.55B | 2.99B |
| Cost & Expenses | 45.41B | 43.52B | 40.33B | 34.16B | 36.56B | 37.47B | 39.09B | 32.60B | 30.22B | 32.37B | 29.49B | 27.17B | 26.44B | 25.15B | 26.51B | 17.71B | 14.72B | 13.25B | 10.90B | 9.84B | 7.81B | 6.57B |
| Interest Income | 458.00M | 462.00M | 431.00M | 315.00M | 410.00M | 333.00M | 287.00M | 561.00M | 339.00M | 335.00M | 286.00M | 206.00M | 438.00M | 525.00M | 501.00M | 288.00M | 167.67M | 219.09M | 120.49M | 107.24M | 0.00 | 0.00 |
| Interest Expense | 4.59B | 4.44B | 5.23B | 5.00B | 4.89B | 4.61B | 5.01B | 4.84B | 2.25B | 2.46B | 2.52B | 2.28B | 3.58B | 4.26B | 4.92B | 1.89B | 1.04B | 843.35M | 805.39M | 340.40M | 0.00 | 0.00 |
| Depreciation & Amortization | 5.39B | 5.07B | 4.77B | 4.60B | 4.66B | 4.62B | 4.37B | 3.48B | 3.15B | 3.35B | 2.99B | 2.75B | 2.78B | 2.79B | 2.82B | 1.91B | 1.50B | 1.34B | 1.05B | 908.25M | 681.33M | 561.40M |
| EBITDA | 18.97B | 18.91B | 17.39B | 11.23B | 22.31B | 17.08B | 20.06B | 16.60B | 16.93B | 19.61B | 17.88B | 16.19B | 15.48B | 13.66B | 15.25B | 7.60B | 7.44B | 5.79B | 3.98B | 2.68B | 1.74B | 1.33B |
| EBITDA Ratio | 31.95% | 32.59% | 35.54% | 26.94% | 42.33% | 36.67% | 38.70% | 30.38% | 38.83% | 40.82% | 41.39% | 40.63% | 42.13% | 41.28% | 27.88% | 34.27% | 38.00% | 33.42% | 30.89% | 23.11% | 19.59% | 18.06% |
| Operating Income | 13.97B | 14.52B | 13.82B | 7.80B | 16.10B | 17.11B | 17.15B | 12.88B | 13.90B | 15.11B | 20.44B | 12.73B | 12.33B | 10.90B | 10.25B | 5.34B | 6.26B | 4.13B | 2.60B | 1.78B | 1.06B | 763.93M |
| Operating Income Ratio | 23.52% | 25.12% | 25.46% | 16.64% | 30.76% | 31.32% | 30.39% | 28.30% | 31.89% | 32.11% | 47.33% | 32.03% | 31.58% | 30.02% | 27.88% | 22.72% | 29.76% | 23.51% | 18.86% | 15.29% | 11.91% | 10.41% |
| Total Other Income/Expenses | -4.84B | -4.99B | -5.36B | -7.54B | -3.32B | -8.67B | -5.82B | -8.55B | -1.44B | -1.31B | -1.91B | -1.74B | -2.66B | -3.22B | -3.91B | -1.54B | -481.77M | -622.95M | -479.68M | -357.09M | -120.90M | -66.11M |
| Income Before Tax | 9.12B | 9.52B | 8.46B | 2.08B | 12.78B | 8.53B | 11.08B | 4.33B | 12.46B | 13.80B | 18.53B | 11.15B | 9.82B | 7.68B | 7.66B | 3.80B | 5.39B | 3.51B | 2.12B | 1.57B | 935.73M | 697.82M |
| Income Before Tax Ratio | 15.37% | 16.48% | 15.58% | 4.44% | 24.41% | 15.62% | 19.62% | 9.52% | 28.58% | 29.32% | 42.91% | 28.05% | 25.14% | 21.16% | 20.85% | 16.17% | 25.62% | 19.97% | 15.38% | 13.55% | 10.55% | 9.51% |
| Income Tax Expense | 2.23B | 1.93B | 2.35B | 1.93B | 2.79B | 2.84B | 1.92B | 1.61B | 2.59B | 2.50B | 2.02B | 1.72B | 1.86B | 1.92B | 1.79B | 674.00M | 946.24M | 700.81M | 463.10M | 356.52M | 232.99M | 169.99M |
| Net Income | 5.34B | 5.97B | 4.67B | 148.00M | 9.17B | 4.37B | 8.00B | 1.24B | 8.27B | 9.22B | 14.39B | 7.24B | 5.86B | 4.03B | 4.61B | 1.93B | 4.44B | 2.81B | 1.66B | 974.68M | 636.00M | 490.05M |
| Net Income Ratio | 8.99% | 10.33% | 8.60% | 0.32% | 17.53% | 8.00% | 14.17% | 2.73% | 18.97% | 19.58% | 33.32% | 18.22% | 15.00% | 11.09% | 12.55% | 8.20% | 21.12% | 15.98% | 12.03% | 8.39% | 7.17% | 6.68% |
| EPS | 2.65 | 2.97 | 2.33 | 0.07 | 4.62 | 2.21 | 4.06 | 0.72 | 5.05 | 5.64 | 8.90 | 4.53 | 3.67 | 2.53 | 2.91 | 1.93 | 3.08 | 1.91 | 1.12 | 1.27 | 0.92 | 0.71 |
| EPS Diluted | 2.60 | 2.91 | 2.28 | 0.07 | 4.53 | 2.17 | 3.98 | 0.71 | 4.96 | 5.54 | 8.72 | 4.45 | 3.63 | 2.50 | 2.91 | 1.93 | 3.06 | 1.90 | 1.11 | 1.26 | 0.91 | 0.70 |
| Weighted Avg Shares Out | 2.02B | 2.01B | 2.01B | 2.00B | 1.98B | 1.98B | 1.97B | 1.72B | 1.64B | 1.63B | 1.62B | 1.60B | 1.60B | 1.59B | 1.59B | 999.00M | 976.00M | 972.53M | 959.73M | 767.79M | 691.01M | 689.41M |
| Weighted Avg Shares Out (Dil) | 2.05B | 2.05B | 2.05B | 2.00B | 2.03B | 2.01B | 2.01B | 1.76B | 1.67B | 1.67B | 1.65B | 1.63B | 1.61B | 1.61B | 1.59B | 1.00B | 981.00M | 980.53M | 964.53M | 772.58M | 694.21M | 695.81M |

Spicing Things Up: 3 Sin Stocks for the Adventurous Investor

Supreme Court Justice Alito sold Bud Light stock, then bought Coors, during boycott
Anheuser-Busch InBev SA/NV (NYSE:BUD) Shares Sold by Meridian Wealth Management LLC
Bud Light boycott may be losing steam as beer brand holds on to more store shelf space than expected: analyst
Anheuser-Busch Continues Its Push to Retake the Crown

The 3 Best Blue-Chip Stocks to Buy in May 2024

AB Inbev is top sector pick for JPMorgan

Arm Holdings, Robinhood, Airbnb, Bud Light parent ABInbev – Markets Defused
AB InBev Stock Jumps as Higher Prices Offset Weak North American Sales
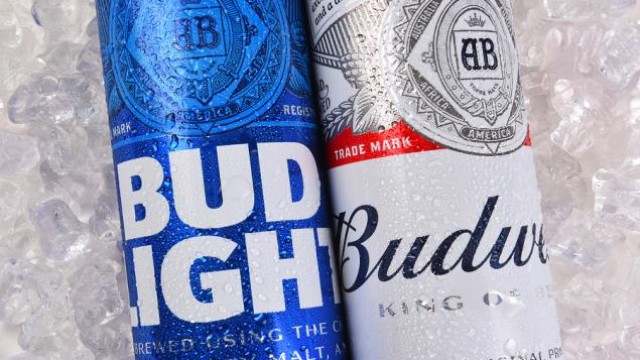
AB InBev (BUD) Surpasses Earnings & Revenue Estimates in Q1
Source: https://incomestatements.info
Category: Stock Reports
