See more : TERA_TERABYTE PLUS (TERA.BK) Income Statement Analysis – Financial Results
Complete financial analysis of Nuburu, Inc. (BURU) income statement, including revenue, profit margins, EPS and key performance metrics. Get detailed insights into the financial performance of Nuburu, Inc., a leading company in the Industrial – Machinery industry within the Industrials sector.
- Wizz Air Holdings Plc (WIZZ.L) Income Statement Analysis – Financial Results
- Al-Jouf Agricultural Development Co. (6070.SR) Income Statement Analysis – Financial Results
- AP Memory Technology Corporation (6531.TW) Income Statement Analysis – Financial Results
- CVS Health Corporation (CVS) Income Statement Analysis – Financial Results
- TTW Public Company Limited (TTAPY) Income Statement Analysis – Financial Results
Nuburu, Inc. (BURU)
About Nuburu, Inc.
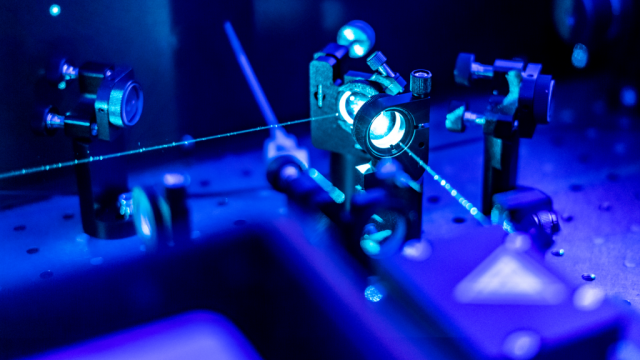
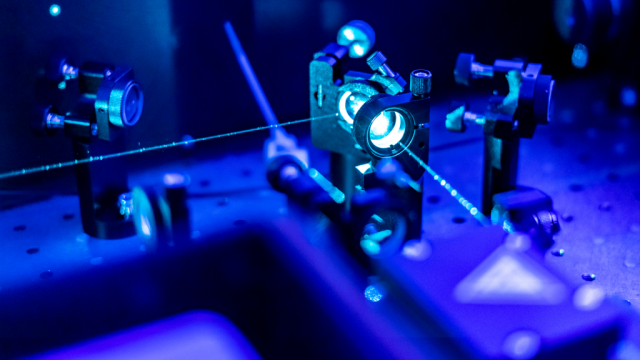
Nuburu, Inc. develops high power precision blue light engine lasers for the metal processing and 3D printing industries worldwide. The company offers Nuburu AO and NUBURU BL series lasers. Its products have applications in battery, e-mobility, consumer electronics, and 3D printing metal systems. Nuburu, Inc. is headquartered in Centennial, Colorado.
| Metric | 2023 | 2022 | 2021 | 2020 |
|---|---|---|---|---|
| Revenue | 2.09M | 1.44M | 376.67K | 692.46K |
| Cost of Revenue | 5.70M | 4.86M | 1.77M | 2.77M |
| Gross Profit | -3.61M | -3.42M | -1.39M | -2.08M |
| Gross Profit Ratio | -173.09% | -237.37% | -368.92% | -300.68% |
| Research & Development | 5.46M | 4.55M | 2.46M | 3.10M |
| General & Administrative | 11.22M | 5.32M | 3.88M | 3.55M |
| Selling & Marketing | 1.54M | 708.14K | 1.65M | 1.31M |
| SG&A | 12.76M | 6.03M | 5.53M | 4.86M |
| Other Expenses | 0.00 | 0.00 | 0.00 | 660.68K |
| Operating Expenses | 18.23M | 10.58M | 8.00M | 7.96M |
| Cost & Expenses | 23.92M | 15.44M | 9.76M | 10.74M |
| Interest Income | 117.37K | 43.98K | 1.17K | 12.76K |
| Interest Expense | 754.55K | 175.29K | 0.00 | 1.65M |
| Depreciation & Amortization | 505.90K | 450.51K | 546.94K | 478.50K |
| EBITDA | -19.45M | -13.50M | -8.84M | -9.57M |
| EBITDA Ratio | -932.42% | -937.45% | -2,346.12% | -1,284.27% |
| Operating Income | -21.84M | -14.00M | -9.39M | -10.05M |
| Operating Income Ratio | -1,047.01% | -971.78% | -2,491.64% | -1,450.63% |
| Total Other Income/Expenses | 1.13M | -131.31K | 27.17M | -979.52K |
| Income Before Tax | -20.71M | -14.13M | -9.38M | -11.02M |
| Income Before Tax Ratio | -992.86% | -980.90% | -2,491.33% | -1,592.09% |
| Income Tax Expense | 0.00 | 358.20K | 1.17K | 2.31M |
| Net Income | -20.71M | -14.13M | -9.38M | -11.02M |
| Net Income Ratio | -992.86% | -980.90% | -2,491.33% | -1,592.09% |
| EPS | -25.05 | -0.29 | -0.22 | -0.26 |
| EPS Diluted | -25.05 | -0.29 | -0.22 | -0.26 |
| Weighted Avg Shares Out | 826.61K | 48.59M | 41.78M | 41.78M |
| Weighted Avg Shares Out (Dil) | 826.61K | 48.59M | 41.78M | 41.78M |

NUBURU Announces Revised Date for Strategic 1-for-40 Reverse Stock Split

NUBURU Announces Strategic 1-for-40 Reverse Stock Split to Enhance Shareholder Value and Return to Trading on NYSE American

NUBURU to Appeal NYSE Commencement of Proceedings to Delist

NYSE American to Commence Delisting Proceedings Against Nuburu, Inc. (BURU)

NUBURU, Inc. CEO Brian Knaley Outlines Strategic Vision and Growth Milestones in Shareholder Letter

NUBURU Expands Japanese Market Presence with JLC Installation of BL250 BlueScan System in Osaka

Why Is Nuburu (BURU) Stock Up 67% Today?

Why Is Nuburu (BURU) Stock Up 100% Today?

NUBURU Enters Medical Device Market with Order from European Manufacturer

NUBURU Announces a Second Contract With NASA for Next-Generation Blue Laser Space Technology
Source: https://incomestatements.info
Category: Stock Reports
