See more : Exela Technologies, Inc. (XELA) Income Statement Analysis – Financial Results
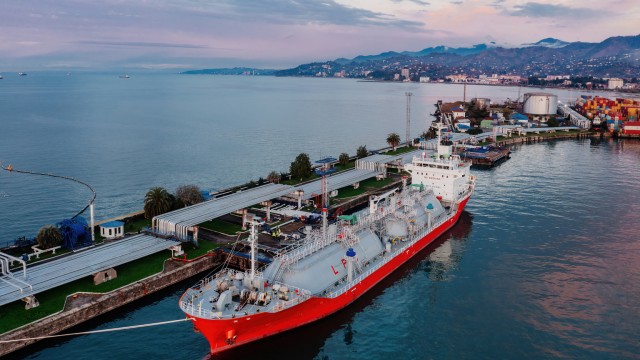
Complete financial analysis of BW LPG Limited (BWLLY) income statement, including revenue, profit margins, EPS and key performance metrics. Get detailed insights into the financial performance of BW LPG Limited, a leading company in the Marine Shipping industry within the Industrials sector.
- Starbucks Corporation (SRB.DE) Income Statement Analysis – Financial Results
- Hotel Rugby Limited (HOTELRUGBY.NS) Income Statement Analysis – Financial Results
- Bhartiya International Ltd. (BIL.NS) Income Statement Analysis – Financial Results
- Olema Pharmaceuticals, Inc. (OLMA) Income Statement Analysis – Financial Results
- Access Intelligence Plc (ACC.L) Income Statement Analysis – Financial Results
BW LPG Limited (BWLLY)
About BW LPG Limited
BW LPG Limited, an investment holding company, engages in shipowning and chartering activities worldwide. The company operates through two segments, Very Large Gas Carriers (VLGCs) and Product Services. It is involved in the transportation of liquefied petroleum gas to oil companies, and trading and utility companies. The company also offers product trading and delivery services. It operates through a fleet of 41 VLGCs. The company was formerly known as BW Gas LPG Holding Limited and changed its name to BW LPG Limited in September 2013. BW LPG Limited was founded in 1935 and is headquartered in Singapore.
| Metric | 2023 | 2022 | 2021 | 2020 | 2019 | 2018 | 2017 | 2016 | 2015 | 2014 | 2013 | 2012 | 2011 | 2010 | 2009 |
|---|---|---|---|---|---|---|---|---|---|---|---|---|---|---|---|
| Revenue | 2.95B | 1.56B | 687.80M | 811.73M | 817.20M | 521.75M | 491.75M | 506.47M | 773.34M | 747.36M | 449.25M | 377.86M | 236.19M | 84.71M | 29.56M |
| Cost of Revenue | 2.27B | 1.30B | 517.37M | 550.57M | 530.08M | 427.41M | 397.57M | 309.23M | 354.62M | 415.00M | 313.63M | 211.43M | 138.36M | 103.42M | 28.26M |
| Gross Profit | 673.06M | 262.91M | 170.43M | 261.16M | 287.13M | 94.35M | 94.18M | 197.24M | 418.72M | 332.37M | 135.62M | 166.43M | 97.83M | -18.72M | 1.31M |
| Gross Profit Ratio | 22.84% | 16.81% | 24.78% | 32.17% | 35.14% | 18.08% | 19.15% | 38.94% | 54.14% | 44.47% | 30.19% | 44.05% | 41.42% | -22.10% | 4.41% |
| Research & Development | 0.00 | 0.00 | 0.00 | 0.00 | 0.00 | 0.00 | 0.00 | 0.00 | 0.00 | 0.00 | 0.00 | 0.00 | 0.00 | 0.00 | 0.00 |
| General & Administrative | 28.85M | 13.89M | 14.19M | 10.19M | 15.81M | 20.19M | 15.40M | 14.87M | 12.03M | 11.94M | 7.90M | 1.90M | 6.20M | 0.00 | 0.00 |
| Selling & Marketing | 161.17M | 0.00 | 0.00 | 0.00 | 0.00 | 0.00 | 0.00 | 0.00 | 0.00 | 0.00 | 0.00 | 0.00 | 0.00 | 0.00 | 0.00 |
| SG&A | 190.03M | 13.89M | 14.19M | 10.19M | 15.81M | 20.19M | 15.40M | 14.87M | 12.03M | 11.94M | 7.90M | 1.90M | 6.20M | 0.00 | 0.00 |
| Other Expenses | 0.00 | 0.00 | 9.84M | 0.00 | 0.00 | 19.00K | 30.00K | 15.00K | -6.81M | 0.00 | 0.00 | 0.00 | 0.00 | 0.00 | 0.00 |
| Operating Expenses | 190.03M | 15.24M | 13.46M | 10.71M | 16.98M | 90.95M | 96.04M | 87.14M | 73.17M | 63.36M | 58.89M | 127.40M | 119.89M | 11.97M | 6.65M |
| Cost & Expenses | 2.46B | 1.32B | 530.83M | 561.28M | 547.06M | 518.36M | 493.61M | 396.36M | 427.79M | 478.35M | 372.52M | 338.83M | 258.26M | 115.39M | 34.91M |
| Interest Income | 10.40M | 2.53M | 4.46M | 6.04M | 6.52M | 5.42M | 889.00K | 188.00K | 143.00K | 135.00K | 52.00K | 8.00K | 5.00K | 10.00K | 14.00K |
| Interest Expense | 27.30M | 29.77M | 38.55M | 43.56M | 57.61M | 50.41M | 46.98M | 27.57M | 16.84M | 10.38M | 5.48M | 3.47M | 6.79M | 4.76M | 3.40M |
| Depreciation & Amortization | 217.88M | 159.43M | 154.20M | 152.45M | 126.27M | 100.67M | 127.30M | 99.43M | 84.72M | 71.04M | 59.45M | 57.49M | 33.39M | 12.23M | 5.24M |
| EBITDA | 700.91M | 406.28M | 379.69M | 440.36M | 403.77M | 106.59M | 124.22M | 318.76M | 428.45M | 338.74M | 136.02M | 96.44M | 12.07M | -19.88M | -273.00K |
| EBITDA Ratio | 23.78% | 25.98% | 47.10% | 50.63% | 49.41% | 20.43% | 25.26% | 62.94% | 55.40% | 45.32% | 30.28% | 25.52% | 5.11% | -23.47% | -0.92% |
| Operating Income | 483.03M | 270.83M | 223.56M | 281.72M | 327.85M | -24.36M | 3.48M | 53.35M | 345.54M | 269.01M | 131.17M | -16.71M | 1.53M | -32.51M | -23.74M |
| Operating Income Ratio | 16.39% | 17.32% | 32.50% | 34.71% | 40.12% | -4.67% | 0.71% | 10.53% | 44.68% | 35.99% | 29.20% | -4.42% | 0.65% | -38.38% | -80.28% |
| Total Other Income/Expenses | 20.93M | -31.18M | -36.62M | -37.37M | 4.90M | -75.63M | -42.43M | -87.65M | -18.66M | -12.64M | -5.46M | -3.44M | -6.51M | -6.19M | -3.57M |
| Income Before Tax | 503.96M | 239.65M | 186.94M | 244.35M | 276.24M | -72.21M | -44.25M | 23.87M | 326.89M | 256.37M | 125.71M | -20.15M | -4.98M | -38.70M | -27.30M |
| Income Before Tax Ratio | 17.10% | 15.33% | 27.18% | 30.10% | 33.80% | -13.84% | -9.00% | 4.71% | 42.27% | 34.30% | 27.98% | -5.33% | -2.11% | -45.69% | -92.36% |
| Income Tax Expense | 10.97M | 1.07M | 521.00K | 499.00K | 2.34M | 178.00K | 544.00K | 233.00K | 749.00K | 697.00K | -53.64M | 56.96M | -23.65M | 392.00K | 18.22M |
| Net Income | 469.96M | 227.40M | 184.82M | 243.85M | 273.84M | -71.40M | -42.69M | 24.28M | 323.97M | 254.57M | 124.74M | -21.45M | -4.18M | -38.70M | -27.30M |
| Net Income Ratio | 15.95% | 14.54% | 26.87% | 30.04% | 33.51% | -13.68% | -8.68% | 4.79% | 41.89% | 34.06% | 27.77% | -5.68% | -1.77% | -45.69% | -92.36% |
| EPS | 3.53 | 1.68 | 1.33 | 1.76 | 1.97 | -0.51 | -0.30 | 0.18 | 2.44 | 1.87 | 0.92 | -0.21 | -0.04 | -0.39 | -0.27 |
| EPS Diluted | 3.53 | 1.68 | 1.33 | 1.76 | 1.97 | -0.51 | -0.30 | 0.18 | 2.44 | 1.87 | 0.92 | -0.21 | -0.04 | -0.39 | -0.27 |
| Weighted Avg Shares Out | 133.03M | 135.42M | 138.95M | 138.23M | 138.72M | 140.22M | 141.78M | 136.58M | 133.07M | 136.06M | 136.28M | 100.00M | 100.00M | 100.00M | 100.00M |
| Weighted Avg Shares Out (Dil) | 133.03M | 135.42M | 138.95M | 138.23M | 138.72M | 140.22M | 141.78M | 136.58M | 133.07M | 136.06M | 136.28M | 100.00M | 100.00M | 100.00M | 100.00M |

BW LPG Limited (BWLP) Q3 2024 Earnings Call Transcript

BW LPG: Fleet Acquisition And Favorable Market Signals Further Growth

BW LPG Limited (BWLLY) Q1 2024 Earnings Call Transcript

BW LPG Limited (BWLLF) Q4 2023 Earnings Call Transcript

BW LPG Q3: While Waiting For Rainfall, It's Raining Dividends

BW LPG Q2 Earnings: Product Services Division Confuses Markets

BW LPG Limited (BWLLF) Q2 2023 Earnings Call Transcript

BW LPG: Still An Attractive Choice For The Income-Oriented Investor

BW LPG: Stronger Than I Expected, But For How Much Longer?

BW LPG Limited (BWLLF) Q4 2022 Earnings Call Transcript
Source: https://incomestatements.info
Category: Stock Reports
