See more : REPT BATTERO Energy Co Ltd (0666.HK) Income Statement Analysis – Financial Results
Complete financial analysis of BYD Company Limited (BYDDF) income statement, including revenue, profit margins, EPS and key performance metrics. Get detailed insights into the financial performance of BYD Company Limited, a leading company in the Auto – Manufacturers industry within the Consumer Cyclical sector.
- Formosa Prosonic Industries Berhad (9172.KL) Income Statement Analysis – Financial Results
- Maruhachi Securities Co., Ltd. (8700.T) Income Statement Analysis – Financial Results
- Noda Corporation (7879.T) Income Statement Analysis – Financial Results
- WOD Retail Solutions Inc. (WODI) Income Statement Analysis – Financial Results
- Securitag Assembly Group Co., Ltd. (6417.TWO) Income Statement Analysis – Financial Results
BYD Company Limited (BYDDF)
About BYD Company Limited
BYD Company Limited, together with its subsidiaries, engages in the research, development, manufacture, and sale of automobiles and related products in the People's Republic of China and internationally. It operates through three segments: Rechargeable Batteries and Photovoltaic Products; Mobile Handset Components, Assembly Service and Other Products; and Automobiles and Related Products and Other Products. The company offers internal combustion, hybrid, and battery-electric passenger vehicles; buses, coaches, and taxis; logistics, construction, and sanitation vehicles; and vehicles for warehousing, port, airport, and mining operations. It also manufactures and sells lithium-ion and nickel batteries, photovoltaic products, and iron batteries primarily for mobile phones, electric tools, and other portable electronic instruments; mobile handset components, such as housings and electronic components; medical protection products; and automobiles, and auto-related molds and components, as well as provides assembly, and automobiles leasing and after sales services. In addition, it offers rail transit equipment; solar batteries and arrays; and urban rail transportation services. The company was founded in 1995 and is headquartered in Shenzhen, China.
| Metric | 2023 | 2022 | 2021 | 2020 | 2019 | 2018 | 2017 | 2016 | 2015 | 2014 | 2013 | 2012 | 2011 | 2010 | 2009 | 2008 | 2007 | 2006 | 2005 | 2004 | 2003 | 2002 |
|---|---|---|---|---|---|---|---|---|---|---|---|---|---|---|---|---|---|---|---|---|---|---|
| Revenue | 602.32B | 424.06B | 216.14B | 156.60B | 127.74B | 130.05B | 105.91B | 103.47B | 80.01B | 58.20B | 52.86B | 48.18B | 48.83B | 48.45B | 41.11B | 27.73B | 21.21B | 13.10B | 6.53B | 6.44B | 4.08B | 2.29B |
| Cost of Revenue | 482.80B | 351.82B | 188.00B | 126.25B | 106.92B | 108.73B | 85.78B | 82.40B | 66.51B | 49.14B | 44.75B | 41.43B | 40.44B | 39.17B | 31.48B | 22.03B | 16.96B | 10.20B | 5.04B | 4.72B | 2.74B | 1.33B |
| Gross Profit | 119.51B | 72.24B | 28.14B | 30.35B | 20.81B | 21.33B | 20.14B | 21.07B | 13.50B | 9.05B | 8.12B | 6.75B | 8.39B | 9.27B | 9.63B | 5.69B | 4.25B | 2.90B | 1.49B | 1.72B | 1.33B | 956.45M |
| Gross Profit Ratio | 19.84% | 17.04% | 13.02% | 19.38% | 16.29% | 16.40% | 19.01% | 20.36% | 16.87% | 15.55% | 15.36% | 14.01% | 17.18% | 19.14% | 23.43% | 20.54% | 20.03% | 22.12% | 22.75% | 26.72% | 32.70% | 41.75% |
| Research & Development | 39.57B | 18.65B | 7.99B | 7.46B | 5.63B | 4.99B | 3.74B | 3.17B | 2.00B | 1.86B | 1.28B | 1.15B | 1.37B | 1.40B | 1.28B | 1.16B | 0.00 | 0.00 | 0.00 | 0.00 | 0.00 | 0.00 |
| General & Administrative | 1.42B | 695.43M | 519.84M | 416.59M | 461.91M | 431.84M | 342.42M | 338.95M | 312.43M | 286.74M | 245.20M | 293.77M | 302.16M | 298.75M | 219.77M | 266.44M | 1.66B | 957.35M | 717.89M | 544.44M | 349.37M | 147.06M |
| Selling & Marketing | 17.39B | 15.06B | 6.08B | 5.06B | 4.35B | 4.73B | 4.93B | 4.20B | 2.87B | 2.23B | 2.01B | 1.51B | 1.80B | 2.18B | 1.49B | 934.23M | 648.19M | 480.18M | 170.09M | 160.34M | 102.39M | 53.84M |
| SG&A | 18.81B | 15.76B | 6.60B | 5.47B | 4.81B | 5.16B | 5.27B | 4.54B | 3.18B | 2.52B | 2.26B | 1.81B | 2.10B | 2.47B | 1.71B | 1.20B | 2.31B | 1.44B | 887.98M | 704.78M | 451.76M | 200.90M |
| Other Expenses | 23.02B | 14.86B | 5.96B | 4.36B | 3.52B | 143.88M | 90.83M | 718.88M | 655.07M | 1.05B | 736.88M | 609.05M | 326.55M | 415.82M | 429.89M | 401.92M | -19.38M | 6.32M | 27.35M | 10.06M | 38.93M | 15.31M |
| Operating Expenses | 81.41B | 49.27B | 20.55B | 17.30B | 13.95B | 13.30B | 11.79B | 12.55B | 9.55B | 7.62B | 6.53B | 7.08B | 6.22B | 6.14B | 4.94B | 3.86B | 2.13B | 1.60B | 918.67M | 720.90M | 461.40M | 202.97M |
| Cost & Expenses | 564.21B | 401.08B | 208.55B | 143.55B | 120.88B | 122.02B | 97.57B | 94.95B | 76.06B | 56.76B | 51.28B | 48.51B | 46.66B | 45.32B | 36.42B | 25.89B | 19.09B | 11.80B | 5.96B | 5.44B | 3.20B | 1.54B |
| Interest Income | 2.80B | 1.83B | 631.84M | 214.61M | 353.76M | 187.23M | 95.78M | 152.70M | 53.42M | 104.68M | 70.12M | 811.92M | 54.82M | 27.43M | 17.64M | 90.95M | 28.48M | 13.96M | 0.00 | 0.00 | 0.00 | 0.00 |
| Interest Expense | 1.83B | 1.32B | 1.91B | 3.12B | 3.49B | 3.12B | 2.34B | 1.80B | 1.52B | 1.40B | 1.02B | 0.00 | 742.26M | 281.38M | 255.39M | 487.62M | 379.05M | 232.99M | 145.61M | 43.06M | 0.00 | 5.42M |
| Depreciation & Amortization | 43.28B | 20.37B | 14.11B | 12.52B | 9.84B | 9.43B | 7.09B | 7.03B | 5.42B | 4.31B | 3.63B | 3.36B | 2.76B | 2.25B | 1.76B | 1.36B | 898.47M | 499.71M | 351.65M | 33.32M | 53.84M | -8.84M |
| EBITDA | 82.38B | 42.68B | 20.51B | 22.49B | 15.72B | 14.83B | 13.94B | 15.15B | 8.93B | 5.57B | 4.97B | 3.24B | 5.23B | 5.67B | 6.52B | 3.21B | 3.02B | 1.80B | 918.22M | 1.00B | 925.13M | 813.47M |
| EBITDA Ratio | 13.68% | 10.56% | 10.03% | 15.77% | 13.26% | 13.80% | 14.49% | 15.58% | 14.12% | 11.82% | 10.90% | 7.42% | 11.73% | 11.84% | 16.77% | 12.32% | 14.22% | 13.75% | 14.06% | 15.53% | 22.70% | 32.89% |
| Operating Income | 38.10B | 21.54B | 7.59B | 12.21B | 7.14B | 4.24B | 5.41B | 5.99B | 3.18B | -179.12M | 106.65M | -304.37M | 1.41B | 2.77B | 4.17B | 990.19M | 2.12B | 1.08B | 457.80M | 966.79M | 919.54M | 762.32M |
| Operating Income Ratio | 6.33% | 5.08% | 3.51% | 7.80% | 5.59% | 3.26% | 5.11% | 5.79% | 3.97% | -0.31% | 0.20% | -0.63% | 2.89% | 5.71% | 10.14% | 3.57% | 9.99% | 8.27% | 7.01% | 15.01% | 22.56% | 33.28% |
| Total Other Income/Expenses | -834.46M | -462.09M | -3.07B | -203.19M | -4.71B | 143.88M | 210.09M | 718.88M | 619.02M | 1.05B | 725.43M | -303.08M | 317.13M | 374.77M | 337.92M | 373.78M | -375.22M | -9.67M | 675.00K | 323.00K | 565.00K | 1.05M |
| Income Before Tax | 37.27B | 21.08B | 4.52B | 6.88B | 2.43B | 4.39B | 5.62B | 6.57B | 3.79B | 873.95M | 832.08M | 290.73M | 1.73B | 3.14B | 4.51B | 1.36B | 1.74B | 1.07B | 458.47M | 967.11M | 920.10M | 763.37M |
| Income Before Tax Ratio | 6.19% | 4.97% | 2.09% | 4.40% | 1.90% | 3.37% | 5.31% | 6.35% | 4.74% | 1.50% | 1.57% | 0.60% | 3.54% | 6.49% | 10.96% | 4.92% | 8.22% | 8.20% | 7.02% | 15.01% | 22.57% | 33.32% |
| Income Tax Expense | 5.92B | 3.37B | 550.74M | 868.62M | 312.27M | 829.45M | 703.71M | 1.09B | 656.79M | 134.08M | 56.22M | 77.84M | 132.41M | 223.68M | 428.01M | 88.32M | 40.55M | 53.08M | 90.04M | 64.43M | 61.57M | 59.45M |
| Net Income | 30.04B | 16.62B | 3.05B | 6.01B | 1.61B | 2.78B | 4.07B | 5.05B | 2.82B | 433.53M | 553.06M | 81.38M | 1.38B | 2.52B | 3.79B | 1.02B | 1.61B | 1.01B | 368.64M | 894.10M | 830.00M | 658.30M |
| Net Income Ratio | 4.99% | 3.92% | 1.41% | 3.84% | 1.26% | 2.14% | 3.84% | 4.88% | 3.53% | 0.74% | 1.05% | 0.17% | 2.84% | 5.21% | 9.23% | 3.68% | 7.60% | 7.71% | 5.65% | 13.88% | 20.36% | 28.74% |
| EPS | 10.32 | 5.71 | 1.06 | 2.20 | 0.59 | 0.93 | 1.40 | 1.88 | 1.12 | 0.18 | 0.23 | 0.03 | 0.60 | 1.11 | 8.85 | 2.50 | 2.99 | 0.49 | 0.18 | 0.44 | 0.40 | 0.32 |
| EPS Diluted | 10.33 | 5.71 | 1.06 | 2.20 | 0.59 | 0.93 | 1.40 | 1.88 | 1.12 | 0.18 | 0.23 | 0.03 | 0.60 | 1.11 | 8.85 | 2.50 | 2.99 | 0.49 | 0.18 | 0.44 | 0.40 | 0.32 |
| Weighted Avg Shares Out | 2.91B | 2.91B | 2.87B | 2.73B | 2.73B | 2.99B | 2.90B | 2.69B | 2.48B | 2.41B | 2.40B | 2.71B | 2.31B | 2.27B | 428.65M | 408.50M | 539.50M | 539.50M | 1.08B | 1.08B | 1.08B | 1.08B |
| Weighted Avg Shares Out (Dil) | 2.91B | 2.91B | 2.87B | 2.73B | 2.73B | 2.99B | 2.90B | 2.69B | 2.52B | 2.41B | 2.40B | 2.71B | 2.31B | 793.10M | 793.10M | 2.04B | 2.05B | 2.05B | 1.08B | 1.08B | 1.08B | 1.08B |
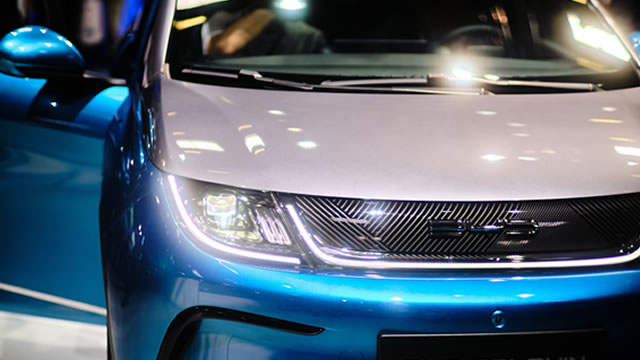
BYD: Charging Up For 2025 - Initiating With A Buy

Chinese electric carmaker BYD sees EV Mexico sales ramping up to 100,000 in 2025

China's BYD wants to build cars in India, but has no 'direct' signal of investment rules easing

Warren Buffett And Cathie Wood Both Own These Two Hot Stocks

Alibaba, NIO, BYD Stocks Slump as China Rally Pauses
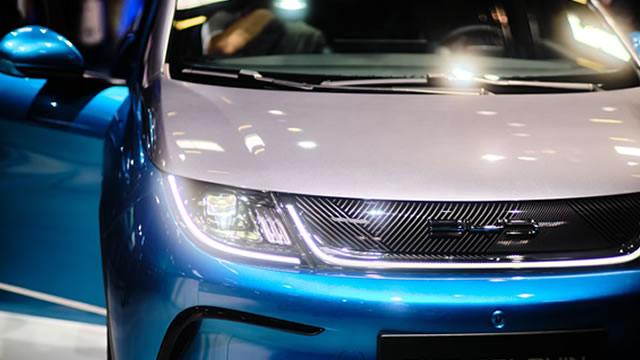
Buy BYD Stock With Automaker Poised To Benefit From Innovation, Macro Stimulus

Ouster: How LIDAR Technology Could Be The Heavy-Duty Detergent Of The 21st Century
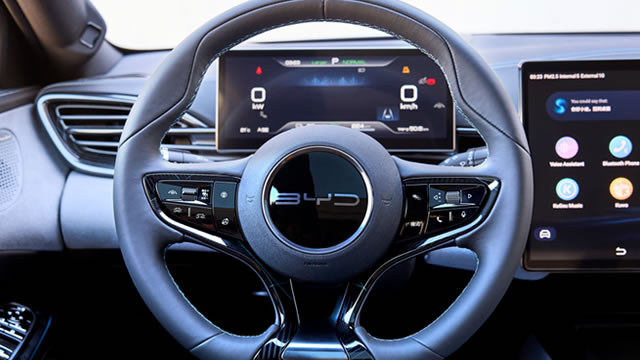
BYD recalling 97,000 top-selling EVs on steering component fault, regulator says
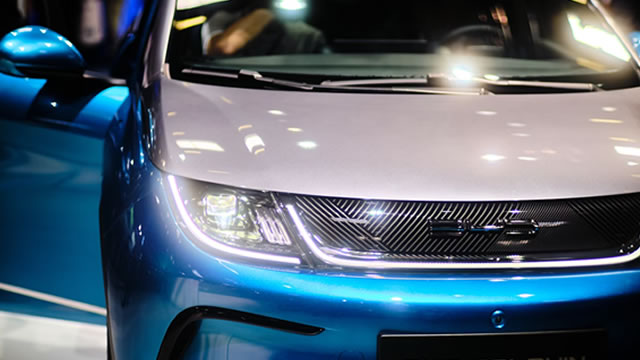
BYD Dominates Brazilian Electric Vehicle Market as Sales Surge
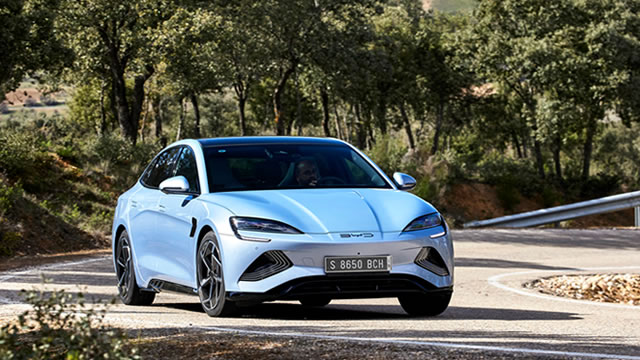
Chinese automaker BYD seeks further easing of Mexico EV tariffs: local media
Source: https://incomestatements.info
Category: Stock Reports
