See more : Winson Holdings Hong Kong Limited (6812.HK) Income Statement Analysis – Financial Results
Complete financial analysis of Central Asia Metals plc (CAMLF) income statement, including revenue, profit margins, EPS and key performance metrics. Get detailed insights into the financial performance of Central Asia Metals plc, a leading company in the Copper industry within the Basic Materials sector.
- JSR Corporation (4185.T) Income Statement Analysis – Financial Results
- Bajel Projects Limited (BAJEL.NS) Income Statement Analysis – Financial Results
- 1867 Western Financial Corporation (WFCL) Income Statement Analysis – Financial Results
- Fujian Funeng Co., Ltd. (600483.SS) Income Statement Analysis – Financial Results
- Luxxu Group Limited (1327.HK) Income Statement Analysis – Financial Results
Central Asia Metals plc (CAMLF)
About Central Asia Metals plc
Central Asia Metals plc, together with its subsidiaries, operates as a base metals producer. The company produces copper, zinc, silver, and lead. It owns a 100% interest in the Kounrad solvent extraction- electrowinning operation located near the city of Balkhash in central Kazakhstan; and a 100% interest in the Sasa mine located in north eastern Macedonia. The company was incorporated in 2005 and is headquartered in London, the United Kingdom.
| Metric | 2023 | 2022 | 2021 | 2020 | 2019 | 2018 | 2017 | 2016 | 2015 | 2014 | 2013 | 2012 | 2011 | 2010 | 2009 | 2008 |
|---|---|---|---|---|---|---|---|---|---|---|---|---|---|---|---|---|
| Revenue | 195.28M | 220.86M | 223.37M | 160.13M | 171.75M | 194.38M | 102.12M | 66.71M | 64.41M | 73.14M | 51.48M | 29.56M | 1.12M | 1.45M | 1.14M | 2.72M |
| Cost of Revenue | 95.74M | 89.44M | 82.63M | 74.60M | 73.10M | 76.42M | 31.43M | 18.39M | 25.51M | 26.02M | 13.78M | 5.77M | 974.49K | 1.40M | 1.12M | 4.41M |
| Gross Profit | 99.54M | 131.42M | 140.75M | 85.53M | 98.65M | 117.96M | 70.70M | 48.32M | 38.90M | 47.12M | 37.71M | 23.79M | 146.87K | 48.54K | 25.87K | -1.69M |
| Gross Profit Ratio | 50.97% | 59.50% | 63.01% | 53.41% | 57.44% | 60.69% | 69.23% | 72.43% | 60.40% | 64.43% | 73.24% | 80.48% | 13.10% | 3.35% | 2.27% | -62.08% |
| Research & Development | 0.00 | 0.00 | 0.00 | 0.00 | 0.00 | 0.00 | 0.00 | 0.00 | 0.00 | 0.00 | 0.00 | 0.00 | 0.00 | 0.00 | 0.00 | 1.33M |
| General & Administrative | 13.39M | 10.23M | 8.47M | 7.47M | 7.73M | 8.54M | 4.20M | 3.68M | 4.53M | 2.97M | 2.61M | 2.60M | 5.40M | 0.00 | 0.00 | 0.00 |
| Selling & Marketing | 17.83M | 0.00 | 0.00 | 2.25M | 1.66M | 184.00K | 108.00K | 44.00K | 31.00K | 15.00K | 123.00K | 17.00K | 6.95K | 383.60K | 407.46K | 81.66K |
| SG&A | 31.22M | 10.23M | 8.47M | 7.47M | 9.39M | 8.72M | 4.20M | 3.73M | 4.56M | 2.99M | 2.73M | 2.62M | 5.41M | 383.60K | 407.46K | 81.66K |
| Other Expenses | 0.00 | 0.00 | 164.00K | -28.00K | 212.00K | 0.00 | 0.00 | -461.55K | -1.57M | 0.00 | 0.00 | 0.00 | 0.00 | 0.00 | 0.00 | 0.00 |
| Operating Expenses | 31.22M | 27.01M | 22.05M | 18.79M | 19.93M | 26.13M | 15.14M | 13.44M | 14.29M | 11.51M | 9.95M | 8.39M | 5.41M | 6.71M | 7.23M | 10.88M |
| Cost & Expenses | 131.78M | 116.44M | 104.68M | 93.39M | 93.03M | 102.54M | 46.57M | 31.83M | 39.80M | 37.53M | 23.73M | 14.16M | 6.38M | 8.11M | 8.35M | 15.29M |
| Interest Income | 1.99M | 515.00K | 74.00K | 116.00K | 336.00K | 261.00K | 323.00K | 67.00K | 41.00K | 61.00K | 17.00K | 8.00K | 231.88K | 43.84K | 24.25K | 309.14K |
| Interest Expense | 1.85M | 2.06M | 3.92M | 6.67M | 11.15M | 15.23M | 2.11M | 5.00K | 304.00K | 334.00K | 412.00K | 220.00K | 40.75K | 78.29K | 3.23K | 58.15K |
| Depreciation & Amortization | 28.19M | 27.29M | 29.57M | 29.15M | 30.08M | 33.34M | 10.93M | 5.08M | 10.39M | 11.41M | 4.63M | 1.36M | 914.44K | 585.57K | 459.20K | 552.66K |
| EBITDA | 95.19M | 139.04M | 142.82M | 95.62M | 109.03M | 121.25M | 62.82M | 38.64M | 43.44M | 48.98M | 32.56M | 16.36M | -4.99M | -6.02M | -14.54M | -12.02M |
| EBITDA Ratio | 48.75% | 62.96% | 66.95% | 59.52% | 63.76% | 62.48% | 70.94% | 57.92% | 68.37% | 66.97% | 63.25% | 55.36% | -444.69% | -278.14% | -1,134.70% | -441.40% |
| Operating Income | 66.68M | 56.13M | 113.17M | 66.35M | 78.61M | 87.42M | 46.51M | 33.65M | 33.01M | 37.51M | 27.91M | 15.00M | -6.13M | -6.65M | -15.00M | -13.75M |
| Operating Income Ratio | 34.15% | 25.41% | 50.67% | 41.44% | 45.77% | 44.97% | 45.54% | 50.44% | 51.25% | 51.28% | 54.22% | 50.73% | -546.91% | -459.96% | -1,314.16% | -505.14% |
| Total Other Income/Expenses | -1.53M | -48.74M | -3.85M | -6.56M | -10.59M | -14.25M | -5.77M | -91.00K | -263.00K | 32.77M | 27.44M | -212.00K | -838.64K | 728.47K | 0.00 | 0.00 |
| Income Before Tax | 65.15M | 54.58M | 109.33M | 59.80M | 67.80M | 72.68M | 49.79M | 33.55M | 32.75M | 70.28M | 55.35M | 14.78M | -5.94M | -6.69M | -15.00M | -13.75M |
| Income Before Tax Ratio | 33.36% | 24.71% | 48.94% | 37.34% | 39.47% | 37.39% | 48.75% | 50.30% | 50.84% | 96.08% | 107.52% | 50.01% | -529.87% | -462.34% | -1,314.16% | -505.14% |
| Income Tax Expense | 27.70M | 20.59M | 25.15M | 16.04M | 15.91M | 18.82M | 13.43M | 6.66M | 10.37M | 10.55M | 6.71M | 4.48M | 5.48M | 1.20M | 1.59M | 1.18M |
| Net Income | 37.31M | 33.81M | 84.18M | 43.67M | 51.88M | 48.02M | 36.32M | 26.27M | 22.39M | 59.47M | 34.49M | 9.79M | -11.19M | -5.84M | -15.00M | -13.75M |
| Net Income Ratio | 19.11% | 15.31% | 37.68% | 27.27% | 30.21% | 24.71% | 35.56% | 39.38% | 34.75% | 81.31% | 67.00% | 33.13% | -998.16% | -403.90% | -1,314.16% | -505.14% |
| EPS | 0.21 | 0.19 | 0.47 | 0.26 | 0.31 | 0.27 | 0.29 | 0.24 | 0.20 | 0.56 | 0.39 | 0.11 | -0.13 | -0.11 | -0.45 | -0.16 |
| EPS Diluted | 0.20 | 0.18 | 0.45 | 0.26 | 0.30 | 0.27 | 0.28 | 0.23 | 0.20 | 0.55 | 0.37 | 0.11 | -0.13 | -0.11 | -0.45 | -0.16 |
| Weighted Avg Shares Out | 181.90M | 177.96M | 176.50M | 176.03M | 175.99M | 176.50M | 125.14M | 111.56M | 111.56M | 106.13M | 88.68M | 89.04M | 86.17M | 51.91M | 32.97M | 86.17M |
| Weighted Avg Shares Out (Dil) | 190.30M | 184.87M | 182.09M | 181.24M | 181.57M | 180.44M | 128.26M | 114.23M | 113.95M | 108.31M | 92.31M | 89.04M | 87.11M | 51.91M | 32.97M | 86.17M |
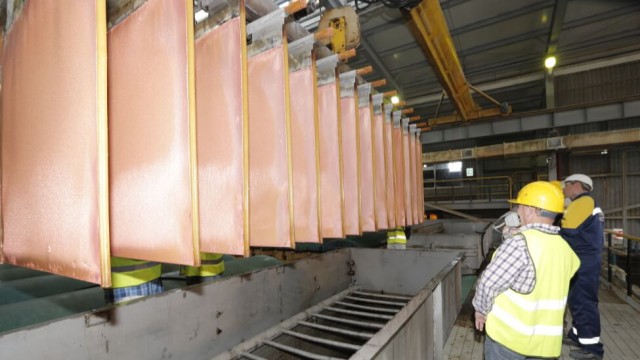
Central Asia Metals copper output hits top end of guidance
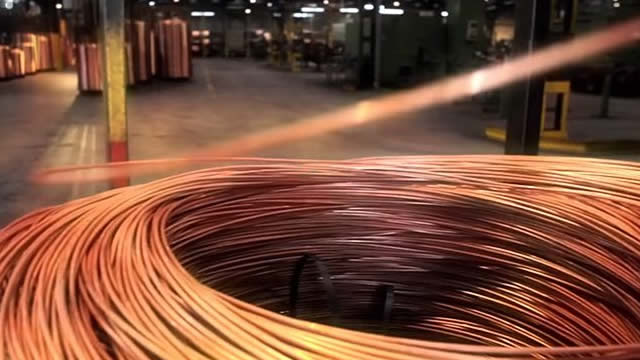
Central Asia Metals profit down in H1 2023 on lower base metals prices, rising costs
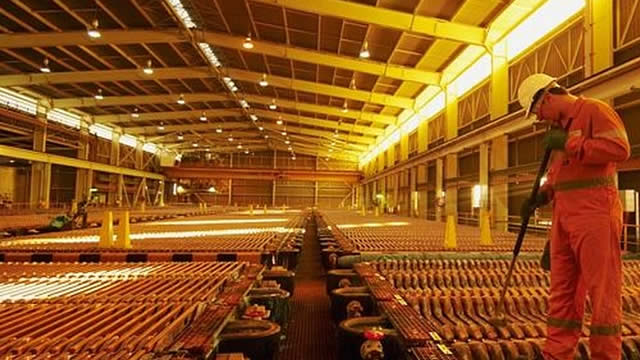
Base metals producer Central Asia Metals reports profit of $33.8 million in 2022, down 60% y-o-y

Barratt, Halfords, Diversified Energy and Central Asia Metals picked as top dividend income stocks
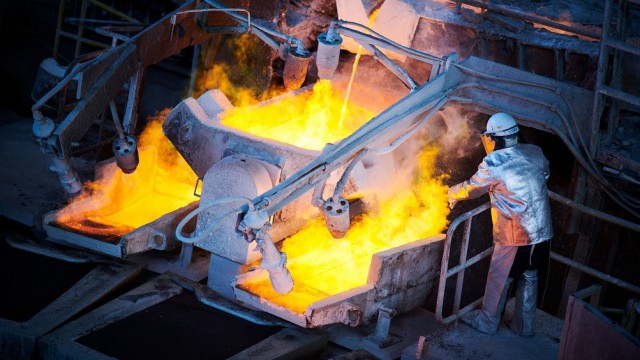
Central Asia Metals 'well placed' to benefit from stronger copper and zinc prices
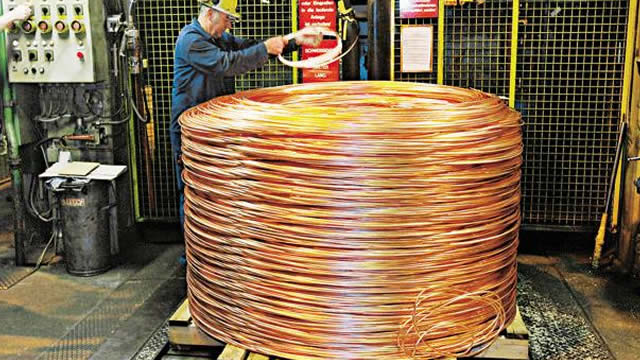
Central Asia Metals increases copper production in 9M 2022, on track to achieve annual guidance
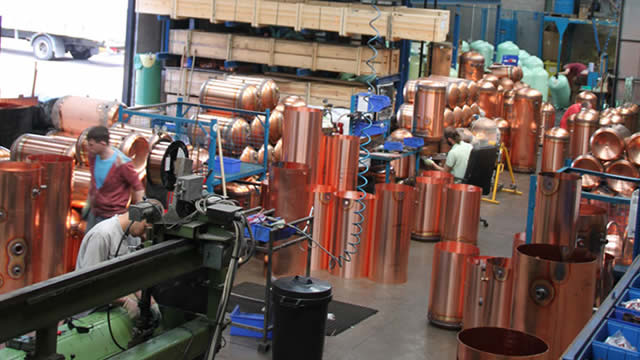
Central Asia Metals reports record interim financial performance in H1 2022, increases dividend
Source: https://incomestatements.info
Category: Stock Reports
