See more : Esautomotion S.p.A. (ESAU.MI) Income Statement Analysis – Financial Results
Complete financial analysis of Gratomic Inc. (CBULF) income statement, including revenue, profit margins, EPS and key performance metrics. Get detailed insights into the financial performance of Gratomic Inc., a leading company in the Industrial Materials industry within the Basic Materials sector.
- Cloud Nine Web3 Technologies Inc. (CNI.CN) Income Statement Analysis – Financial Results
- ENM Holdings Limited (ENMHF) Income Statement Analysis – Financial Results
- Industrial & Commercial Bank of China Ltd. (IDCBY) Income Statement Analysis – Financial Results
- Williston Holding Company, Inc. (WHCA) Income Statement Analysis – Financial Results
- Kairos Minerals Limited (MPJFF) Income Statement Analysis – Financial Results
Gratomic Inc. (CBULF)
About Gratomic Inc.
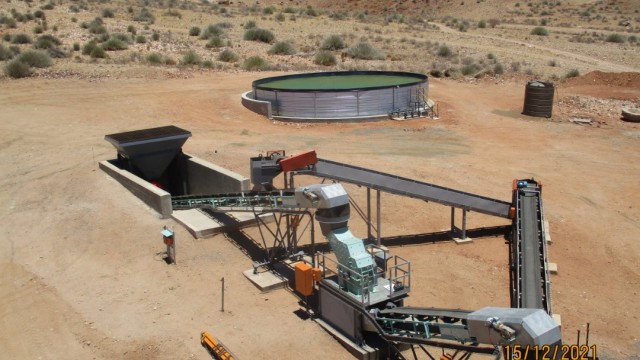
Gratomic Inc., a junior exploration company, engages in the acquisition and exploration of assets primarily in Canada and Namibia. It explores for base and rare metals, industrial minerals, and precious metals. The company holds a 100% interest in the Aukam graphite project located in the district of Bethanie, Karas Region of southern Namibia covers an area of approximately 137,473 hectares; and a 100% interest in the Buckingham graphite property that includes eight claim blocks covering an area of approximately 480 hectares located in the Quebec, Canada. It also holds a 100% interest in the Capim Grosso Property, which comprises an area of 426.03 hectares located in Capim Grosso, Brazil. The company was formerly known as CKR Carbon Corporation and changed its name to Gratomic Inc. in December 2017. Gratomic Inc. was incorporated in 2007 and is based in Toronto, Canada.
| Metric | 2023 | 2022 | 2021 | 2020 | 2019 | 2018 | 2017 | 2016 | 2015 | 2014 | 2013 | 2012 | 2011 | 2010 | 2009 | 2008 | 2007 |
|---|---|---|---|---|---|---|---|---|---|---|---|---|---|---|---|---|---|
| Revenue | 0.00 | 0.00 | 0.00 | 0.00 | 0.00 | 0.00 | 0.00 | 0.00 | 0.00 | 0.00 | 0.00 | 0.00 | 0.00 | 0.00 | 0.00 | 6.55K | 0.00 |
| Cost of Revenue | 265.97K | 391.72 | 248.19 | 0.00 | 70.71K | 30.44K | 43.68K | 0.00 | 0.00 | 0.00 | 0.00 | 0.00 | 0.00 | 0.00 | 0.00 | 0.00 | 0.00 |
| Gross Profit | -265.97K | -391.72 | -248.19 | 0.00 | -70.71K | -30.44K | -43.68K | 0.00 | 0.00 | 0.00 | 0.00 | 0.00 | 0.00 | 0.00 | 0.00 | 6.55K | 0.00 |
| Gross Profit Ratio | 0.00% | 0.00% | 0.00% | 0.00% | 0.00% | 0.00% | 0.00% | 0.00% | 0.00% | 0.00% | 0.00% | 0.00% | 0.00% | 0.00% | 0.00% | 100.00% | 0.00% |
| Research & Development | 0.00 | 0.00 | 0.00 | 0.00 | 0.00 | 0.00 | 0.00 | 0.00 | 0.00 | 0.00 | 0.00 | 0.00 | 0.00 | 0.00 | 0.00 | 0.00 | 0.00 |
| General & Administrative | 2.84M | 5.72M | 19.39M | 1.76M | 2.58M | 2.67M | 1.61M | 400.00K | 602.82K | 514.99K | 741.83K | 572.82K | 1.17M | 255.39K | 254.58K | 116.74K | 0.00 |
| Selling & Marketing | 1.75M | 1.25M | 1.35M | 499.43K | 697.59K | 754.30K | 212.70K | 67.09K | 15.49K | 0.00 | 0.00 | 0.00 | 0.00 | 0.00 | 0.00 | 0.00 | 0.00 |
| SG&A | 4.92M | 6.97M | 20.74M | 2.26M | 3.28M | 3.42M | 1.82M | 467.08K | 618.31K | 514.99K | 741.83K | 572.82K | 1.17M | 255.39K | 254.58K | 116.74K | 5.89K |
| Other Expenses | 0.00 | 0.00 | 0.00 | 0.00 | 72.31K | 25.41K | 28.92K | 0.00 | 0.00 | 0.00 | 0.00 | 0.00 | -72.81K | 0.00 | 0.00 | 0.00 | 0.00 |
| Operating Expenses | 4.92M | 7.37M | 20.99M | 2.26M | 3.28M | 3.42M | 1.82M | 467.08K | 618.31K | 514.99K | 741.83K | 572.82K | 1.17M | 255.39K | 254.58K | 123.22K | 5.89K |
| Cost & Expenses | 5.18M | 7.37M | 20.99M | 2.26M | 3.28M | 3.42M | 1.87M | 467.08K | 618.31K | 514.99K | 741.83K | 572.82K | 1.17M | 255.39K | 254.58K | 123.22K | 5.89K |
| Interest Income | 7.50 | 40.00 | 0.00 | 200.35 | 0.00 | 0.00 | 90.00 | 0.00 | 0.00 | 0.00 | 0.00 | 0.00 | 0.00 | 390.00 | 740.00 | 0.00 | 0.00 |
| Interest Expense | 0.00 | 0.00 | 0.00 | 200.35K | 0.00 | 0.00 | 0.00 | 1.13K | 3.96K | 8.26K | 11.61K | 39.07K | 0.00 | 0.00 | 0.00 | 0.00 | 0.00 |
| Depreciation & Amortization | 5.18M | 322.33K | 322.33K | 2.20M | 70.71K | 30.44K | 43.68K | 162.82K | 417.54K | 417.54K | 391.12K | 0.00 | 0.00 | 0.00 | 0.00 | 0.00 | 0.00 |
| EBITDA | 0.00 | -6.58M | -20.67M | 0.00 | -3.31M | -3.18M | -1.78M | -467.08K | -154.06K | -514.99K | -741.83K | -572.82K | -1.17M | -255.39K | -254.58K | -116.66K | -5.89K |
| EBITDA Ratio | 0.00% | 0.00% | 0.00% | 0.00% | 0.00% | 0.00% | 0.00% | 0.00% | 0.00% | 0.00% | 0.00% | 0.00% | 0.00% | 0.00% | 0.00% | -1,780.28% | 0.00% |
| Operating Income | -5.18M | -6.58M | -20.99M | -2.26M | -3.31M | -3.42M | -1.87M | -467.08K | -618.31K | -514.99K | -741.83K | -572.82K | -1.17M | -255.39K | -254.58K | -116.66K | -5.89K |
| Operating Income Ratio | 0.00% | 0.00% | 0.00% | 0.00% | 0.00% | 0.00% | 0.00% | 0.00% | 0.00% | 0.00% | 0.00% | 0.00% | 0.00% | 0.00% | 0.00% | -1,780.28% | 0.00% |
| Total Other Income/Expenses | -128.45K | -989.91K | -927.10K | -1.44M | 62.63K | 25.41K | 29.01K | -145.23K | 83.26K | -431.14K | -357.48K | -2.92M | -72.81K | 0.00 | 0.00 | 0.00 | 0.00 |
| Income Before Tax | -5.31M | -8.16M | -21.31M | -3.64M | -3.24M | -3.40M | -1.84M | -612.31K | -535.05K | -946.13K | -1.13M | -3.49M | -1.24M | 0.00 | 0.00 | 0.00 | 0.00 |
| Income Before Tax Ratio | 0.00% | 0.00% | 0.00% | 0.00% | 0.00% | 0.00% | 0.00% | 0.00% | 0.00% | 0.00% | 0.00% | 0.00% | 0.00% | 0.00% | 0.00% | 0.00% | 0.00% |
| Income Tax Expense | 0.00 | 790.90K | -322.33 | 198.15K | -102.02K | -161.14K | -90.00 | -161.69K | -413.58K | -409.28K | -34.45K | -2.56K | -137.50K | 255.00K | 253.84K | 116.66K | 5.89K |
| Net Income | -5.31M | -8.16M | -21.31M | -3.64M | -3.24M | -3.40M | -1.84M | -612.31K | -535.05K | -946.13K | -1.10M | -3.49M | -1.11M | -255.00K | -253.84K | -116.66K | -5.89K |
| Net Income Ratio | 0.00% | 0.00% | 0.00% | 0.00% | 0.00% | 0.00% | 0.00% | 0.00% | 0.00% | 0.00% | 0.00% | 0.00% | 0.00% | 0.00% | 0.00% | -1,780.28% | 0.00% |
| EPS | -0.03 | -0.05 | -0.15 | -0.07 | -0.09 | -0.14 | -0.03 | -0.02 | -0.03 | -0.17 | -0.30 | -7.26 | -3.30 | -0.22 | -0.38 | -0.59 | -0.01 |
| EPS Diluted | -0.03 | -0.05 | -0.15 | -0.07 | -0.09 | -0.14 | -0.03 | -0.02 | -0.03 | -0.17 | -0.30 | -7.26 | -3.30 | -0.22 | -0.38 | -0.59 | -0.01 |
| Weighted Avg Shares Out | 196.76M | 179.38M | 144.86M | 49.53M | 34.22M | 25.03M | 70.11M | 32.86M | 16.37M | 5.51M | 3.62M | 480.52K | 335.04K | 1.16M | 674.11K | 197.91K | 433.34K |
| Weighted Avg Shares Out (Dil) | 196.76M | 179.38M | 144.86M | 49.53M | 34.22M | 25.03M | 70.11M | 32.86M | 16.37M | 5.51M | 3.62M | 480.52K | 335.04K | 1.16M | 674.11K | 197.91K | 433.34K |

Gratomic announces key leadership appointments

Gratomic Announces Company and Operational Update

Gratomic unveils debt settlement plan

Gratomic Announces up to $1.4 Million Debt Settlement

Gratomic provides strategic update and announces board changes

Gratomic Provides Update on Strategic Path

Gratomic signs letter of intent for $5.2M royalty financing

Gratomic Signs Letter of Intent for $5.2 Million Royalty Financing

Gratomic strengthens Namibian government ties, appoints government liaison consultant

Gratomic Retains Government Liaison Consultant
Source: https://incomestatements.info
Category: Stock Reports
