Complete financial analysis of Columbia Care Inc. (CCHWF) income statement, including revenue, profit margins, EPS and key performance metrics. Get detailed insights into the financial performance of Columbia Care Inc., a leading company in the Drug Manufacturers – Specialty & Generic industry within the Healthcare sector.
- Vikas EcoTech Limited (VIKASECO.NS) Income Statement Analysis – Financial Results
- Omni Bridgeway Limited (IMMFF) Income Statement Analysis – Financial Results
- Laurentian Bank of Canada (LRCDF) Income Statement Analysis – Financial Results
- Inter Globe Finance Limited (INTRGLB.BO) Income Statement Analysis – Financial Results
- Moog Inc. (MOG-B) Income Statement Analysis – Financial Results
Columbia Care Inc. (CCHWF)
About Columbia Care Inc.
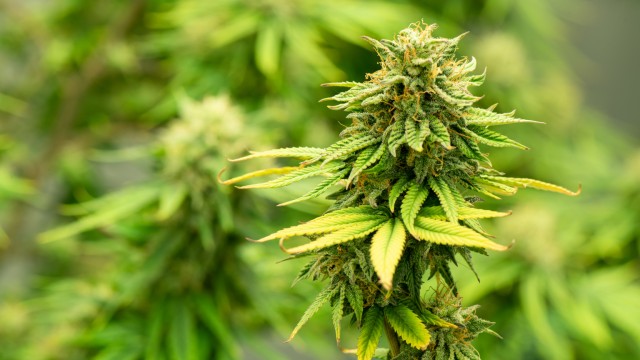
Columbia Care Inc. cultivates, manufactures, and provides cannabis products and related services. It offers flowers, edibles, oils, and tablets under the Seed & Strain, Triple Seven, gLeaf, Classix, Press, Amber, and Platinum Label CBD brands. The company holds licenses in 18 jurisdictions in the United States and the European Union. As of June 15, 2022, it operated 131 facilities, including 99 dispensaries and 32 cultivation and manufacturing facilities. The company was founded in 2012 and is headquartered in New York, New York.
| Metric | 2022 | 2021 | 2020 | 2019 | 2018 |
|---|---|---|---|---|---|
| Revenue | 511.58M | 460.08M | 179.50M | 77.46M | 0.00 |
| Cost of Revenue | 310.37M | 266.07M | 113.53M | 40.60M | 0.00 |
| Gross Profit | 201.21M | 194.02M | 65.98M | 36.86M | 0.00 |
| Gross Profit Ratio | 39.33% | 42.17% | 36.76% | 47.59% | 0.00% |
| Research & Development | 0.00 | 0.00 | 0.00 | 0.00 | 0.00 |
| General & Administrative | 203.69M | 179.48M | 118.34M | 105.44M | 0.00 |
| Selling & Marketing | 14.17M | 16.26M | 6.08M | 5.79M | 0.00 |
| SG&A | 617.45M | 195.73M | 124.42M | 111.24M | 0.00 |
| Other Expenses | -16.45M | 36.32M | 15.65M | 7.45M | 0.00 |
| Operating Expenses | 617.45M | 232.05M | 140.07M | 118.68M | 0.00 |
| Cost & Expenses | 927.82M | 498.12M | 253.60M | 159.28M | 0.00 |
| Interest Income | 0.00 | 0.00 | 0.00 | 0.00 | 0.00 |
| Interest Expense | 53.90M | 30.01M | 0.00 | 0.00 | 0.00 |
| Depreciation & Amortization | 84.79M | 53.00M | 42.02M | 26.26M | 161.14K |
| EBITDA | -416.24M | 13.64M | -32.08M | -55.56M | 0.00 |
| EBITDA Ratio | -81.36% | 2.96% | -17.87% | -71.73% | 0.00% |
| Operating Income | -416.24M | -39.37M | -74.10M | -81.82M | 0.00 |
| Operating Income Ratio | -81.36% | -8.56% | -41.28% | -105.63% | 0.00% |
| Total Other Income/Expenses | -16.45M | -107.35M | -62.77M | -12.04M | 0.00 |
| Income Before Tax | -432.69M | -146.71M | -136.87M | -93.85M | 0.00 |
| Income Before Tax Ratio | -84.58% | -31.89% | -76.25% | -121.17% | 0.00% |
| Income Tax Expense | -11.21M | 139.00K | -3.67M | 12.87M | 0.00 |
| Net Income | -421.48M | -146.85M | -133.20M | -106.73M | 0.00 |
| Net Income Ratio | -82.39% | -31.92% | -74.20% | -137.79% | 0.00% |
| EPS | -1.16 | -0.43 | -0.57 | -0.51 | 0.00 |
| EPS Diluted | -1.16 | -0.43 | -0.57 | -0.51 | 0.00 |
| Weighted Avg Shares Out | 363.17M | 338.75M | 232.58M | 209.99M | 209.99M |
| Weighted Avg Shares Out (Dil) | 363.17M | 338.75M | 232.58M | 209.99M | 209.99M |

Top Cannabis Stocks To Watch Now? 3 For April

Finding The Long-Term Winners In The Cannabis Sector

3 Marijuana Stocks For Cannabis Investing 2023

Best Marijuana Stocks To Buy? 3 Penny Stocks To Watch Next Week

Cannabis Investing Podcast Roundtable (Transcript)

Will $2 billion merger of Cresco and Columbia Care reach the finish line? Analysts see ‘market doubt' for cannabis deal.

Cannabis Company Columbia Care Is A Bargain

Cannabis Is A Long-Term Play (Podcast Transcript)

Top Marijuana Stocks For December Watchlist Right Now

Top Marijuana Penny Stocks To Watch In December
Source: https://incomestatements.info
Category: Stock Reports
