Complete financial analysis of Cloud DX Inc. (CDXFF) income statement, including revenue, profit margins, EPS and key performance metrics. Get detailed insights into the financial performance of Cloud DX Inc., a leading company in the Medical – Healthcare Information Services industry within the Healthcare sector.
- Drozapol-Profil S.A. (DPL.WA) Income Statement Analysis – Financial Results
- Selective Insurance Group, Inc. (SIGIP) Income Statement Analysis – Financial Results
- Accsys Technologies PLC (ACSYF) Income Statement Analysis – Financial Results
- Sitio Royalties Corp. (STR-WT) Income Statement Analysis – Financial Results
- Zimtu Capital Corp. (ZC.V) Income Statement Analysis – Financial Results
Cloud DX Inc. (CDXFF)
Industry: Medical - Healthcare Information Services
Sector: Healthcare
Website: https://www.clouddx.com
About Cloud DX Inc.
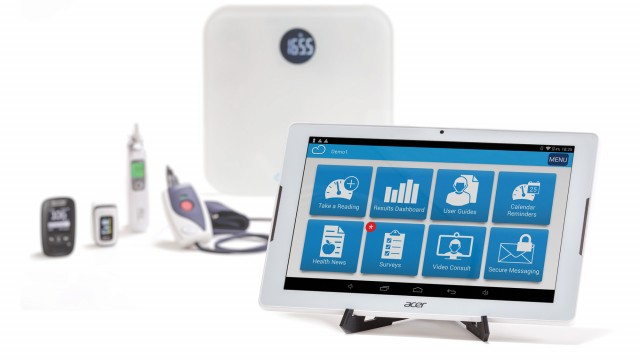
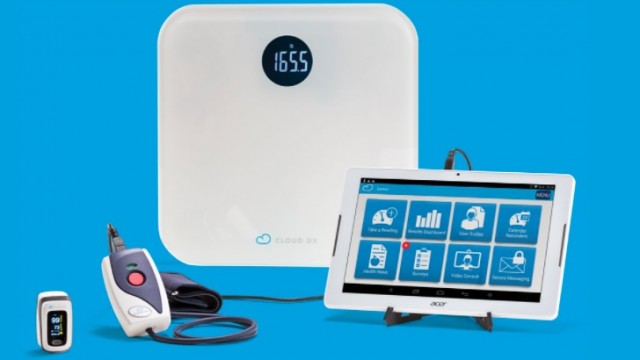
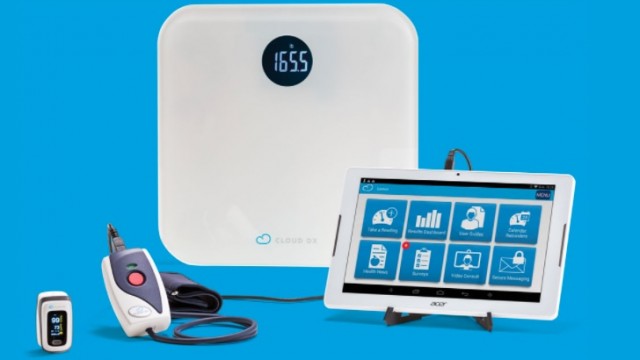
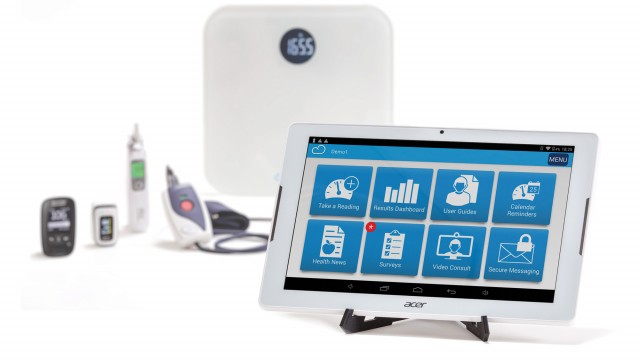
Cloud DX Inc. operates as a remote patient monitoring company. It offers Cloud DX Connected Health, an end-to-end virtual healthcare platform for monitoring patients with chronic illness, including chronic obstructive pulmonary disease and congestive heart failure, as well as patients recovering from surgery and COVID-19 patients outside hospitals. The company's Cloud DX Connected Health Kits includes its Cloud DX Bluetooth pulse oximeter, the Cloud DX wireless weight scale and optionally, a wireless Bluetooth blood pressure monitor, digital thermometer, and digital wireless glucose meter from 3rd party suppliers. It serves academic institutions, large hospitals, and provincial health authorities in Canada, as well as physician practices and hospitals in the United States. The company also offers VITALITI, a vital sign monitor for measuring electrocardiograph, heart rate, oxygen saturation, respiration, core body temperature, blood pressure, movement, steps, and posture. Cloud DX Inc. is headquartered in Brooklyn, New York.
| Metric | 2023 | 2022 | 2021 | 2020 | 2019 | 2018 |
|---|---|---|---|---|---|---|
| Revenue | 1.81M | 1.17M | 782.30K | 1.16M | 1.25M | 247.77K |
| Cost of Revenue | 529.21K | 563.11K | 491.29K | 732.60K | 228.17K | 127.76K |
| Gross Profit | 1.28M | 602.90K | 291.01K | 431.20K | 1.02M | 120.01K |
| Gross Profit Ratio | 70.79% | 51.71% | 37.20% | 37.05% | 81.76% | 48.44% |
| Research & Development | 192.99K | 397.93K | 473.88K | 550.52K | 252.57K | 317.86K |
| General & Administrative | 6.90M | 9.11M | 9.34M | 5.97M | 842.16K | 1.08M |
| Selling & Marketing | 252.73K | 312.08K | 468.63K | 116.35K | 153.70K | 159.75K |
| SG&A | 7.15M | 9.43M | 9.80M | 6.08M | 287.20K | 6.44M |
| Other Expenses | 1.67M | -18.79K | 0.00 | 0.00 | 0.00 | 0.00 |
| Operating Expenses | 9.02M | 9.83M | 9.48M | 5.58M | 287.20K | 7.03M |
| Cost & Expenses | 9.55M | 10.39M | 9.97M | 6.31M | 287.20K | 7.16M |
| Interest Income | 0.00 | 1.60M | 709.40K | 732.23K | 336.99K | 224.11K |
| Interest Expense | 3.37M | 1.60M | 709.40K | 732.23K | 0.00 | 0.00 |
| Depreciation & Amortization | 477.96K | 498.77K | 407.95K | 340.14K | 164.51K | 168.72K |
| EBITDA | -6.93M | -8.79M | -10.24M | -4.74M | -4.40M | -6.82M |
| EBITDA Ratio | -382.42% | -748.52% | -1,122.64% | -412.98% | -22.96% | -2,751.18% |
| Operating Income | -7.74M | -9.72M | -10.42M | -6.55M | -287.20K | -6.99M |
| Operating Income Ratio | -426.90% | -833.54% | -1,332.04% | -562.81% | -22.96% | -2,819.27% |
| Total Other Income/Expenses | -3.04M | -1.17M | -934.58K | 737.73K | -4.68M | -146.18K |
| Income Before Tax | -10.78M | -10.89M | -11.36M | -5.81M | -312.20K | -7.13M |
| Income Before Tax Ratio | -594.93% | -934.04% | -1,451.51% | -499.42% | -24.95% | -2,878.27% |
| Income Tax Expense | -433.91K | -273.89K | -98.22K | 732.31K | -164.51K | 0.00 |
| Net Income | -10.35M | -10.62M | -11.26M | -5.81M | -312.20K | -7.13M |
| Net Income Ratio | -570.99% | -910.55% | -1,438.95% | -499.42% | -24.95% | -2,878.27% |
| EPS | -0.11 | -0.15 | -0.18 | -0.67 | -0.27 | -5.39 |
| EPS Diluted | -0.11 | -0.15 | -0.18 | -0.67 | -0.27 | -5.39 |
| Weighted Avg Shares Out | 93.13M | 72.09M | 64.28M | 8.73M | 1.14M | 1.32M |
| Weighted Avg Shares Out (Dil) | 93.13M | 72.09M | 64.28M | 8.73M | 1.14M | 1.32M |

Cloud DX subsidiary files notice of intention to restructure

Cloud DX Inc. Announces Restructuring Process and the Resignation of 2 Directors
Cloud DX sees revenue and profit surge in Q1 amid key contract wins

Cloud DX Reports Results for the First Quarter of 2024
Cloud DX hails $9.4mln British Columbia health contract as 'milestone'
Cloud DX hails $9.4mln British Columbia health contract as 'milestone'
Cloud DX wins multi-year contract with provincial health authority

CLOUD DX Signs Multi-Year Contract with Provincial Health Authority
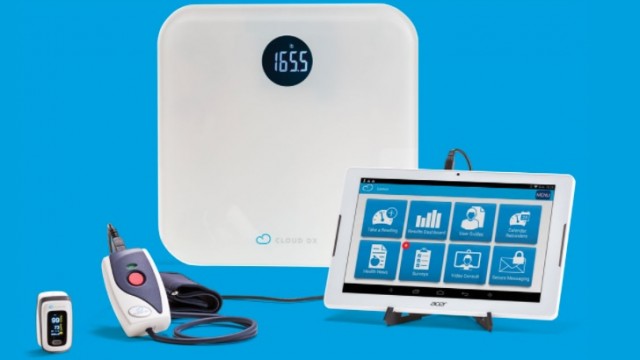
Cloud DX doubles gross profit in 2023 amid surge in revenue
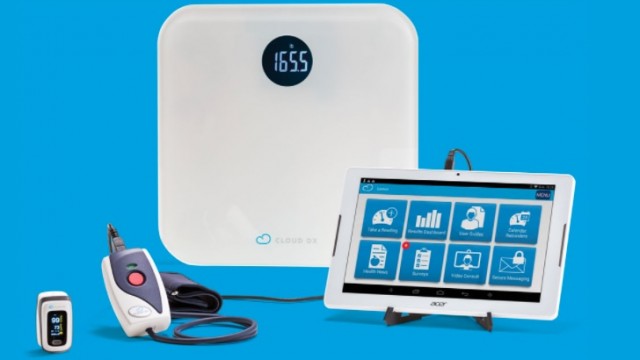
Cloud DX doubles gross profit in 2023 amid surge in revenue
Source: https://incomestatements.info
Category: Stock Reports
