See more : Sparinvest Danske Aktier KL (SPIDKAKLA.CO) Income Statement Analysis – Financial Results
Complete financial analysis of CrossFirst Bankshares, Inc. (CFB) income statement, including revenue, profit margins, EPS and key performance metrics. Get detailed insights into the financial performance of CrossFirst Bankshares, Inc., a leading company in the Banks – Regional industry within the Financial Services sector.
- Jindal Drilling & Industries Limited (JINDRILL.NS) Income Statement Analysis – Financial Results
- J.K. Cement Limited (JKCEMENT.NS) Income Statement Analysis – Financial Results
- DS Smith Plc (DSSMY) Income Statement Analysis – Financial Results
- Turmeric Acquisition Corp. (TMPMU) Income Statement Analysis – Financial Results
- KAP Industrial Holdings Limited (KAP.JO) Income Statement Analysis – Financial Results
CrossFirst Bankshares, Inc. (CFB)
About CrossFirst Bankshares, Inc.
CrossFirst Bankshares, Inc. operates as the bank holding company for CrossFirst Bank that provides various banking and financial services to businesses, business owners, professionals, and its personal networks. The company offers commercial real estate, construction and development, 1-4 family real estate, commercial, energy, and consumer loans. It also provides a range of deposit products consisting of noninterest-bearing demand and interest-bearing deposits, which include transaction accounts, savings accounts, money market accounts, and certificates of deposit; and personal and business checking and savings accounts, as well as negotiable order of withdrawal accounts; and brokered and reciprocal deposits. In addition, the company offers international banking services; treasury management services; automated teller machine access; and mobile banking services. Further, it holds investments in marketable securities. As of December 31, 2021, it had nine full-service banking offices in Kansas, Missouri, Oklahoma, Arizona, and Texas. CrossFirst Bankshares, Inc. was founded in 2007 and is headquartered in Leawood, Kansas.
| Metric | 2023 | 2022 | 2021 | 2020 | 2019 | 2018 | 2017 |
|---|---|---|---|---|---|---|---|
| Revenue | 231.02M | 77.00K | 182.35M | 171.98M | 150.58M | 116.62M | 80.40M |
| Cost of Revenue | 0.00 | 0.00 | 0.00 | 0.00 | 0.00 | -4.00K | 0.00 |
| Gross Profit | 231.02M | 77.00K | 182.35M | 171.98M | 150.58M | 116.62M | 80.40M |
| Gross Profit Ratio | 100.00% | 100.00% | 100.00% | 100.00% | 100.00% | 100.00% | 100.00% |
| Research & Development | 0.00 | 0.00 | 0.00 | 0.00 | 0.00 | 0.00 | 0.00 |
| General & Administrative | 96.44M | 78.64M | 64.79M | 62.05M | 59.90M | 54.57M | 44.44M |
| Selling & Marketing | 2.89M | 3.20M | 2.09M | 1.22M | 2.46M | 2.69M | 2.65M |
| SG&A | 99.33M | 81.84M | 66.88M | 63.27M | 62.36M | 57.26M | 47.09M |
| Other Expenses | 0.00 | 50.63M | -162.26M | -219.94M | -164.33M | -120.67M | -100.08M |
| Operating Expenses | 122.78M | 132.47M | -95.38M | -156.67M | -101.97M | -52.91M | -52.99M |
| Cost & Expenses | 122.78M | 132.47M | -95.38M | -156.67M | -101.97M | -52.91M | -52.99M |
| Interest Income | 435.15M | 248.51M | 193.15M | 203.45M | 216.22M | 156.88M | 97.14M |
| Interest Expense | 210.31M | 54.98M | 24.46M | 43.20M | 74.77M | 46.51M | 23.00M |
| Depreciation & Amortization | 9.46M | 5.31M | 5.26M | 5.25M | 1.73M | 1.79M | 1.27M |
| EBITDA | 93.57M | 82.88M | 92.23M | 20.57M | 37.93M | 0.00 | 0.00 |
| EBITDA Ratio | 40.50% | 179,033.77% | 50.58% | 11.96% | 33.43% | 58.64% | 37.89% |
| Operating Income | 84.11M | 132.55M | 86.97M | 15.31M | 48.61M | 63.71M | 27.41M |
| Operating Income Ratio | 36.41% | 172,144.16% | 47.69% | 8.90% | 32.28% | 54.63% | 34.09% |
| Total Other Income/Expenses | 0.00 | -17.47M | -15.89M | -21.61M | -10.90M | -10.79M | -6.44M |
| Income Before Tax | 84.11M | 77.57M | 86.97M | 15.31M | 48.61M | 17.20M | 4.41M |
| Income Before Tax Ratio | 36.41% | 100,742.86% | 47.69% | 8.90% | 32.28% | 14.75% | 5.48% |
| Income Tax Expense | 17.44M | 15.97M | 17.56M | 2.71M | 8.05M | -2.39M | -1.44M |
| Net Income | 66.67M | 61.60M | 69.41M | 12.60M | 40.56M | 19.59M | 5.85M |
| Net Income Ratio | 28.86% | 79,998.70% | 38.07% | 7.33% | 26.93% | 16.80% | 7.27% |
| EPS | 1.35 | 1.24 | 1.35 | 0.24 | 0.85 | 0.38 | 0.07 |
| EPS Diluted | 1.34 | 1.23 | 1.33 | 0.24 | 0.83 | 0.38 | 0.07 |
| Weighted Avg Shares Out | 49.01M | 49.49M | 51.29M | 52.07M | 47.68M | 51.12M | 51.12M |
| Weighted Avg Shares Out (Dil) | 49.34M | 50.00M | 52.03M | 52.55M | 48.58M | 51.12M | 51.12M |

CrossFirst Bankshares, Inc. To Host Second Quarter 2023 Earnings Call

Cleanroom Film & Bags Adds Capacity to Serve Increasing Demand for Cleanroom Nylon Films and Bags

CrossFirst Bankshares, Inc. to Expand Arizona Franchise with Acquisition of Canyon Bancorporation, Inc. and Canyon Community Bank, N.A.

CrossFirst Bankshares (CFB) Tops Q1 Earnings and Revenue Estimates

CrossFirst Bank Expands Texas Presence to Fort Worth

CrossFirst Bankshares, Inc. To Host First Quarter 2023 Earnings Call

CrossFirst Bankshares, Inc. To Host First Quarter 2023 Earnings Call
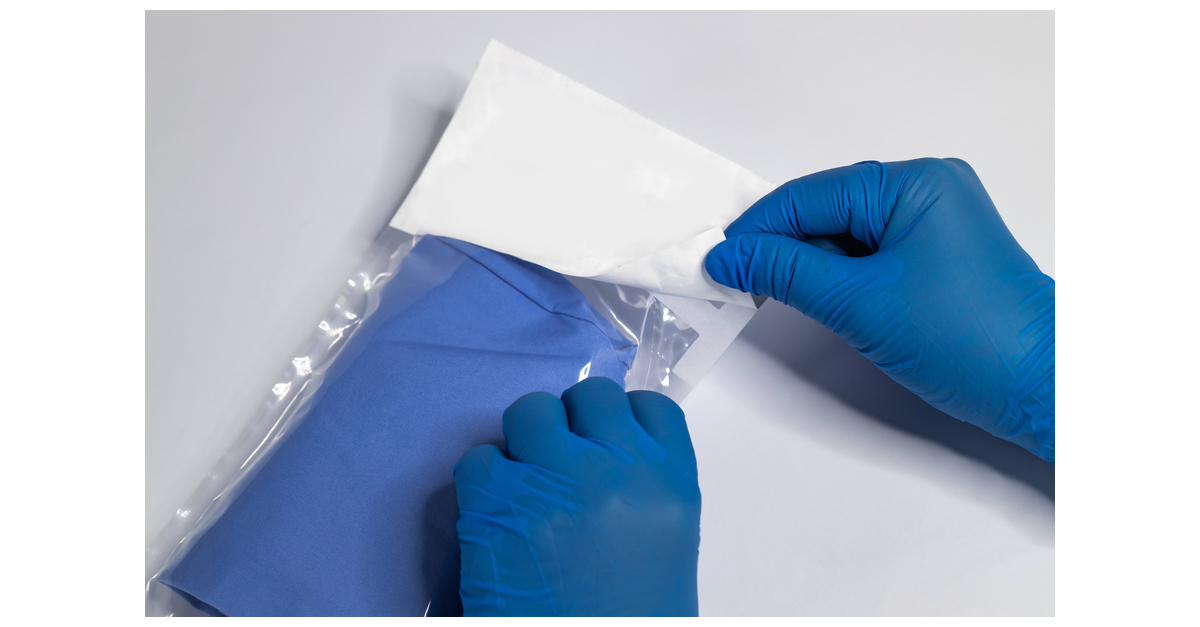
Cleanroom Film & Bags Expands Offering of Customized Sterilizable Packaging
CrossFirst Bank Expands Experienced Leadership Team
Ameresco Reports Fourth Quarter and Full Year 2022 Financial Results
Source: https://incomestatements.info
Category: Stock Reports
