See more : Rubicon Technologies, Inc. (RBT) Income Statement Analysis – Financial Results
Complete financial analysis of The China Fund, Inc. (CHN) income statement, including revenue, profit margins, EPS and key performance metrics. Get detailed insights into the financial performance of The China Fund, Inc., a leading company in the Asset Management industry within the Financial Services sector.
- Jinxin Fertility Group Limited (1951.HK) Income Statement Analysis – Financial Results
- Excellon Resources Inc. (EXN) Income Statement Analysis – Financial Results
- Stanley Black & Decker, Inc. (SWK) Income Statement Analysis – Financial Results
- Legato Merger Corp. (LEGOU) Income Statement Analysis – Financial Results
- Formosan Union Chemical Corp. (1709.TW) Income Statement Analysis – Financial Results
The China Fund, Inc. (CHN)
About The China Fund, Inc.
The China Fund, Inc. is a closed ended equity mutual fund launched and managed by Allianz Global Investors U.S. LLC. It invests in the public equity markets of China that includes the People's Republic of China, Hong Kong, and Taiwan. The fund invests in stocks of companies operating across diversified sectors. It employs a combination of fundamental analysis with bottom-up approach and quantitative analysis to create its portfolio. The fund seeks to benchmarks the performance of its portfolio against the MSCI Golden Dragon Index. The China Fund, Inc. was formed on April 28, 1992 and is domiciled in the United States.
| Metric | 2024 | 2023 | 2022 | 2021 | 2020 | 2019 | 2018 | 2017 | 2016 | 2015 | 2014 | 2013 | 2012 | 2011 | 2010 | 2009 | 2008 | 2007 | 2006 | 2005 | 2004 | 2003 |
|---|---|---|---|---|---|---|---|---|---|---|---|---|---|---|---|---|---|---|---|---|---|---|
| Revenue | 28.21M | 11.22M | -117.47M | 12.36M | 106.61M | 59.00M | -54.89M | 81.15M | -23.44M | 8.62M | 10.01M | 11.62M | 13.20M | 13.86M | 12.70M | 12.86M | 16.41M | 10.79M | 9.47M | 7.04M | 5.85M | 4.11M |
| Cost of Revenue | 0.00 | 0.00 | 1.62M | 2.71M | 2.19M | 2.61M | 3.66M | 3.21M | 2.90M | 3.16M | 3.23M | 3.50M | 5.17M | 6.45M | 6.22M | 5.15M | 5.87M | 5.15M | 3.74M | 2.89M | 2.54M | 2.27M |
| Gross Profit | 28.21M | 11.22M | -119.08M | 9.65M | 104.42M | 56.39M | -58.55M | 77.93M | -26.33M | 5.46M | 6.78M | 8.12M | 8.03M | 7.41M | 6.48M | 7.71M | 10.54M | 5.64M | 5.73M | 4.15M | 3.31M | 1.84M |
| Gross Profit Ratio | 100.00% | 100.00% | 101.38% | 78.07% | 97.95% | 95.58% | 106.67% | 96.04% | 112.35% | 63.31% | 67.74% | 69.88% | 60.83% | 53.46% | 51.02% | 59.95% | 64.23% | 52.27% | 60.51% | 58.95% | 56.58% | 44.77% |
| Research & Development | 0.00 | 0.00 | -18.55 | 0.14 | 4.05 | 2.78 | -1.37 | 4.52 | -0.25 | 0.00 | 0.00 | 0.00 | 0.00 | 0.00 | 0.00 | 0.00 | 0.00 | 0.00 | 0.00 | 0.00 | 0.00 | 0.00 |
| General & Administrative | 954.29K | 2.06M | 937.21K | 969.90K | 954.90K | 1.68M | 4.20M | 2.27M | 4.02M | 4.53M | 4.76M | 4.99M | 1.77M | 1.50M | 1.72M | 1.40M | 2.08M | 1.51M | 1.33M | 1.20M | 1.22M | 1.19M |
| Selling & Marketing | 0.00 | 157.00K | 0.00 | 0.00 | 0.00 | 0.00 | 0.00 | 0.00 | 109.61K | 88.84K | 86.60K | 89.67K | 0.00 | 0.00 | 0.00 | 0.00 | 0.00 | 0.00 | 0.00 | 0.00 | 0.00 | 0.00 |
| SG&A | 954.29K | 2.21M | 937.21K | 969.90K | 954.90K | 1.68M | 4.20M | 2.27M | -0.25 | 4.62M | 4.85M | 5.08M | 1.77M | 1.50M | 1.72M | 1.40M | 2.08M | 1.51M | 1.33M | 1.20M | 1.22M | 1.19M |
| Other Expenses | 27.26M | 0.00 | 70.43K | 60.07K | 83.82K | 160.28K | 343.29K | 231.01K | 15.72M | 35.25K | 160.00K | 50.00K | 420.00K | -320.00K | 70.00K | 100.00K | -20.00K | 10.00K | 10.00K | 0.00 | 0.00 | 10.00K |
| Operating Expenses | 28.21M | 2.21M | 1.01M | 1.03M | 1.04M | 1.84M | 4.54M | 2.50M | 5.53M | 17.07M | 17.49M | 58.98M | 2.19M | 1.18M | 1.79M | 1.50M | 2.06M | 1.52M | 1.34M | 1.20M | 1.22M | 1.20M |
| Cost & Expenses | 28.21M | 2.21M | 1.01M | 1.03M | 1.04M | 1.84M | 4.54M | 2.50M | -26.33M | 17.07M | 17.49M | 58.98M | 7.36M | 7.63M | 8.01M | 6.65M | 7.93M | 6.67M | 5.08M | 4.09M | 3.76M | 3.47M |
| Interest Income | 60.66K | 52.26K | 15.37K | 238.00 | 24.72K | 81.68K | 15.62K | 2.24K | 0.00 | 0.00 | 0.00 | 0.00 | 0.00 | 0.00 | 0.00 | 0.00 | 0.00 | 0.00 | 0.00 | 0.00 | ||
| Interest Expense | 0.00 | 0.00 | 0.00 | 0.00 | 0.00 | 0.00 | 0.00 | 0.00 | 22.34M | 64.06M | 0.00 | 0.00 | 165.67M | 251.60M | 0.00 | 474.68M | 149.97M | -9.42M | 9.09M | 123.20M | ||
| Depreciation & Amortization | 0.00 | 1.13M | 570.16K | -670.93K | -675.28K | -1.56M | -2.27M | -2.88M | -7.30M | -4.00M | -5.16M | -6.54M | -100.85M | -166.23M | 331.34M | 503.20M | -885.94M | 952.77M | 299.91M | -18.72M | 18.21M | 245.68M |
| EBITDA | 0.00 | 10.13M | -118.44M | 0.00 | 105.00M | 55.88M | -59.65M | 75.68M | -1.51M | -7.39M | 22.34M | 64.06M | -95.02M | -160.00M | 336.03M | 509.41M | -877.46M | 956.89M | 304.31M | -15.77M | 20.30M | 246.32M |
| EBITDA Ratio | 0.00% | 90.31% | 100.86% | 91.67% | 99.03% | 96.88% | 108.27% | 96.92% | 124.71% | -144.58% | 223.16% | 551.31% | -719.85% | -1,154.40% | 2,645.91% | 3,961.20% | -5,347.11% | 8,868.30% | 3,213.41% | -224.01% | 347.01% | 5,993.19% |
| Operating Income | 0.00 | 9.00M | -118.47M | 11.33M | 105.57M | 57.15M | -59.44M | 78.64M | 7.30M | 4.00M | 5.16M | 6.54M | 5.83M | 6.23M | 4.69M | 6.21M | 8.48M | 4.12M | 4.40M | 2.95M | 2.09M | 640.00K |
| Operating Income Ratio | 0.00% | 80.26% | 100.86% | 91.67% | 99.03% | 96.88% | 108.27% | 96.92% | -31.16% | 46.44% | 51.52% | 56.24% | 44.17% | 44.95% | 36.93% | 48.29% | 51.68% | 38.18% | 46.46% | 41.90% | 35.73% | 15.57% |
| Total Other Income/Expenses | 27.23M | 1.10M | -117.90M | 10.66M | 0.00 | 0.00 | 0.00 | 75.75M | -1.39M | -12.46M | -381.44K | 64.06M | -50.42M | -78.98M | -519.00 | 261.82M | -442.97M | 478.09M | 149.94M | -9.30M | 9.12M | 122.48M |
| Income Before Tax | 27.23M | 10.10M | -118.47M | 11.33M | 105.57M | 57.15M | -59.44M | 78.64M | 5.91M | -8.46M | 27.50M | 70.60M | -44.59M | -72.75M | 170.36M | 257.81M | -434.49M | 482.21M | 154.34M | -6.35M | 11.21M | 123.12M |
| Income Before Tax Ratio | 96.53% | 90.06% | 100.86% | 91.67% | 99.03% | 96.88% | 108.27% | 96.92% | -25.21% | -98.14% | 274.68% | 607.55% | -337.80% | -524.89% | 1,341.42% | 2,004.74% | -2,647.71% | 4,469.05% | 1,629.78% | -90.20% | 191.62% | 2,995.62% |
| Income Tax Expense | 0.00 | 0.00 | -601.89K | 566.17K | 566.08K | 1.27M | 216.65K | 2.97M | 5.79M | -12.46M | 22.34M | 64.06M | 0.00 | 0.00 | 0.00 | 0.00 | 0.00 | 0.00 | 0.00 | 0.00 | 0.00 | 0.00 |
| Net Income | 27.23M | 10.10M | -118.47M | 11.33M | 105.57M | 57.15M | -59.44M | 78.64M | 5.79M | -8.46M | 27.50M | 70.60M | -44.59M | -72.75M | 170.36M | 257.81M | -434.49M | 482.21M | 154.34M | -6.35M | 11.21M | 123.12M |
| Net Income Ratio | 96.53% | 90.06% | 100.86% | 91.67% | 99.03% | 96.88% | 108.27% | 96.92% | -24.71% | -98.14% | 274.68% | 607.55% | -337.80% | -524.89% | 1,341.42% | 2,004.74% | -2,647.71% | 4,469.05% | 1,629.78% | -90.20% | 191.62% | 2,995.62% |
| EPS | 2.74 | 1.01 | -11.55 | 1.09 | 10.10 | 5.36 | -3.78 | 5.00 | 0.98 | -0.54 | 1.75 | 4.50 | -2.76 | -3.19 | 7.48 | 11.32 | -23.94 | 33.07 | 10.64 | -0.44 | 1.11 | 12.23 |
| EPS Diluted | 2.74 | 1.01 | -11.55 | 1.09 | 10.10 | 5.36 | -3.78 | 5.00 | 15.41M | -0.54 | 1.75 | 4.50 | -2.76 | -3.19 | 7.48 | 11.32 | -23.94 | 33.07 | 10.64 | -0.44 | 1.11 | 12.23 |
| Weighted Avg Shares Out | 9.92M | 10.03M | 10.26M | 10.37M | 10.45M | 10.66M | 15.72M | 15.72M | 5.91M | 15.68M | 15.68M | 15.68M | 16.17M | 22.78M | 22.78M | 22.78M | 18.15M | 14.58M | 14.50M | 14.39M | 10.08M | 10.07M |
| Weighted Avg Shares Out (Dil) | 9.92M | 10.03M | 10.26M | 10.37M | 10.45M | 10.66M | 15.72M | 15.73M | 0.38 | 15.68M | 15.68M | 15.68M | 16.17M | 22.78M | 22.78M | 22.78M | 18.15M | 14.58M | 14.50M | 14.39M | 10.08M | 10.07M |

Domestic Demand Drives Chinese Economic Recovery Amid Export Woes

What The PMIs Aren't Really Saying, In China As Elsewhere

Profiting From Uncertainty

Mid-Year Outlook: A Slow, Uneven Economic Recovery In The Second Half

AIO, NCV, NCZ, CBH and ACV Declare Monthly Distributions

A Collapsing Dollar And China's Monetary Strategy
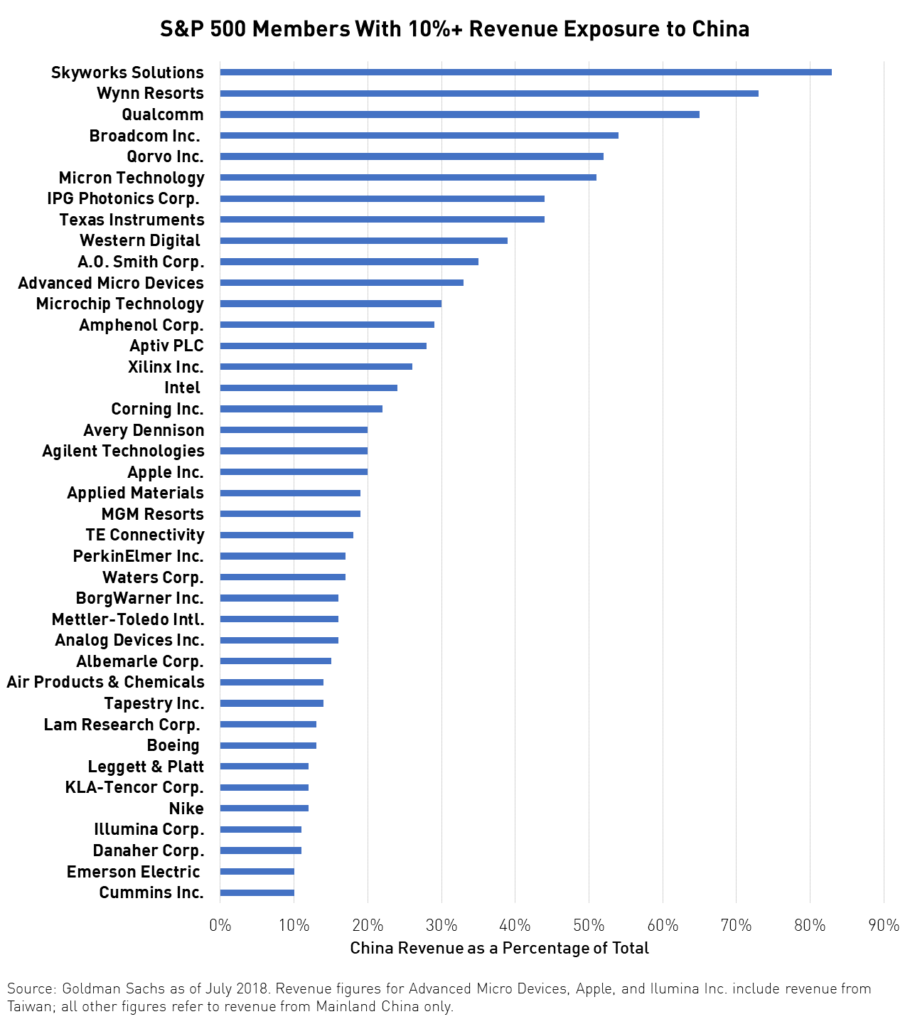
Top 5 Reasons A Win-Win Relationship With China Benefits The U.S. Economy
The Chemist's Closed-End Fund Report, June 2020: Valuations And Sentiment Improving
PCTEL to Present Virtually and Host 1x1 Investor Meetings at 10th Annual East Coast IDEAS Investor Conference June 23 and 24
Source: https://incomestatements.info
Category: Stock Reports

