See more : Top Spring International Holdings Limited (3688.HK) Income Statement Analysis – Financial Results
Complete financial analysis of Cool Company Ltd. (CLCO) income statement, including revenue, profit margins, EPS and key performance metrics. Get detailed insights into the financial performance of Cool Company Ltd., a leading company in the Marine Shipping industry within the Industrials sector.
- Shenzhen Wongtee International Enterprise Co., Ltd. (000056.SZ) Income Statement Analysis – Financial Results
- Wisr Limited (WZR.AX) Income Statement Analysis – Financial Results
- Xior Student Housing NV (XIOR.BR) Income Statement Analysis – Financial Results
- Udaipur Cement Works Limited (UDAICEMENT.BO) Income Statement Analysis – Financial Results
- Selecta Biosciences, Inc. (SELB) Income Statement Analysis – Financial Results
Cool Company Ltd. (CLCO)
About Cool Company Ltd.
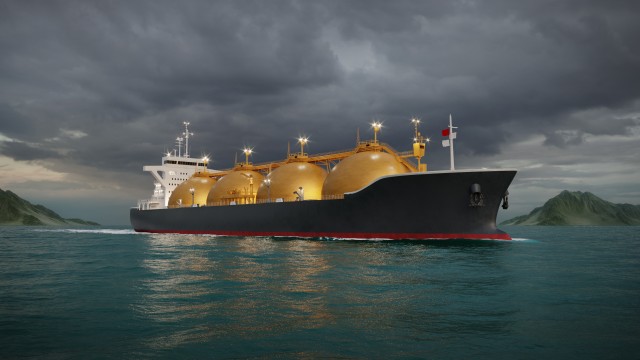
Cool Company Ltd. engages in the ownership, operation, and management of liquefied natural gas carriers (LNGCs) that provides supply chain support solutions for energy industry. The company owns and operates a fleet of LNGCs, including tri-fuel diesel electric vessels; and floating storage and regasification units for third parties. Cool Company Ltd. was incorporated in 2018 and is headquartered in Hamilton, Bermuda.
| Metric | 2023 | 2022 | 2021 |
|---|---|---|---|
| Revenue | 361.38M | 220.32M | 161.96M |
| Cost of Revenue | 136.32M | 97.77M | 93.54M |
| Gross Profit | 225.07M | 122.54M | 68.41M |
| Gross Profit Ratio | 62.28% | 55.62% | 42.24% |
| Research & Development | 0.00 | 0.00 | 0.00 |
| General & Administrative | 24.17M | 15.28M | 586.00K |
| Selling & Marketing | 0.00 | -1.54M | 0.00 |
| SG&A | 24.17M | 13.74M | 586.00K |
| Other Expenses | 0.00 | 0.00 | 0.00 |
| Operating Expenses | 24.17M | 13.74M | 566.00K |
| Cost & Expenses | 160.49M | 111.51M | 94.11M |
| Interest Income | 6.96M | 1.25M | 7.00K |
| Interest Expense | 80.19M | 30.08M | 18.09M |
| Depreciation & Amortization | 59.00M | 58.97M | 43.48M |
| EBITDA | 328.04M | 174.98M | 110.83M |
| EBITDA Ratio | 90.78% | 76.15% | 68.43% |
| Operating Income | 200.89M | 108.81M | 72.85M |
| Operating Income Ratio | 55.59% | 49.39% | 44.98% |
| Total Other Income/Expenses | -23.97M | -22.88M | -18.50M |
| Income Before Tax | 176.92M | 85.93M | 54.35M |
| Income Before Tax Ratio | 48.96% | 39.00% | 33.56% |
| Income Tax Expense | 556.00K | 108.87K | 27.09M |
| Net Income | 174.73M | 84.10M | 21.85M |
| Net Income Ratio | 48.35% | 38.17% | 13.49% |
| EPS | 3.25 | 1.57 | 15.30 |
| EPS Diluted | 3.25 | 1.57 | 15.30 |
| Weighted Avg Shares Out | 53.70M | 53.69M | 1.01M |
| Weighted Avg Shares Out (Dil) | 53.69M | 53.69M | 1.01M |

Cool Company Ltd. (CLCO) Surges 5.6%: Is This an Indication of Further Gains?

CoolCo Enters Into a Long-Term Charter With GAIL (India) Limited for Newbuild LNG Carrier

Cool Company Ltd. Announces First Quarter 2024 Earnings Release Date

LNG Shipping Stocks: Preparation For A Bullish Move

Cool Company: Quality Fleet, 73% PNAV, And 14.7% Yield; Rating Unchanged

Cool Company Ltd. - Announcement Of Filing Of Form 20-F Annual Report

Cool Company Ltd. - Ex Dividend

Cool Company Ltd. (CLCO) Q4 2023 Earnings Call Transcript

Key Information Relating to the Cash Dividend to Be Paid by Cool Company Ltd. (TICKER: CLCO)

Cool Company Ltd. Q4 2023 Business Update
Source: https://incomestatements.info
Category: Stock Reports
