See more : MS INTERNATIONAL plc (MSI.L) Income Statement Analysis – Financial Results
Complete financial analysis of Clean Seed Capital Group Ltd. (CLGPF) income statement, including revenue, profit margins, EPS and key performance metrics. Get detailed insights into the financial performance of Clean Seed Capital Group Ltd., a leading company in the Agricultural – Machinery industry within the Industrials sector.
- GSV, Inc. (GSVI) Income Statement Analysis – Financial Results
- Telecom Argentina S.A. (TECO2.BA) Income Statement Analysis – Financial Results
- Sampo Oyj (SAXPF) Income Statement Analysis – Financial Results
- Brembo S.p.A. (BRBOY) Income Statement Analysis – Financial Results
- Eternal Energy Public Company Limited (EE.BK) Income Statement Analysis – Financial Results
Clean Seed Capital Group Ltd. (CLGPF)
About Clean Seed Capital Group Ltd.
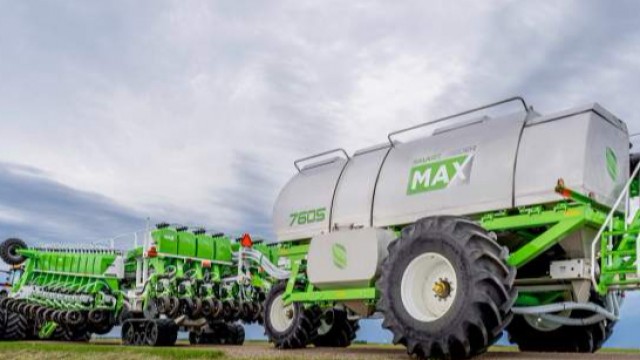
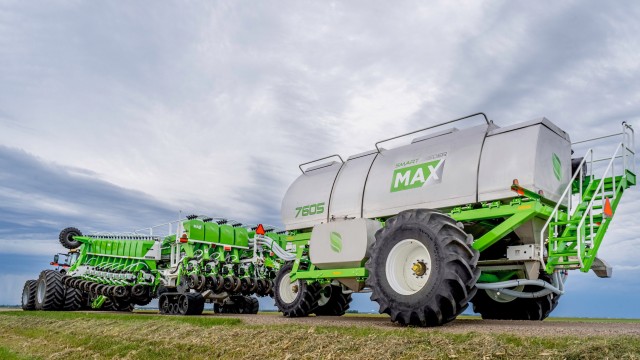
Clean Seed Capital Group Ltd., together with its subsidiaries, operates in the agriculture equipment industry in North America. It offers seeding and planting equipment. The company focuses on the development of the SMART Seeder MAX-S prototype and commercialization of the related SMART Seeder technology. It is also involved in the software development business. Clean Seed Capital Group Ltd. was incorporated in 2010 and is headquartered in Burnaby, Canada.
| Metric | 2023 | 2022 | 2021 | 2020 | 2019 | 2018 | 2017 | 2016 | 2015 | 2014 | 2013 | 2012 | 2011 |
|---|---|---|---|---|---|---|---|---|---|---|---|---|---|
| Revenue | 0.00 | 1.27M | 7.39K | 5.20M | 0.00 | 0.00 | 0.00 | 1.05M | 0.00 | 0.00 | 0.00 | 0.00 | 0.00 |
| Cost of Revenue | 0.00 | 0.00 | 0.00 | 0.00 | 736.86K | 622.72K | 536.41K | 860.79K | 0.00 | 0.00 | 0.00 | 0.00 | 0.00 |
| Gross Profit | 0.00 | 1.27M | 7.39K | 5.20M | -736.86K | -622.72K | -536.41K | 189.21K | 0.00 | 0.00 | 0.00 | 0.00 | 0.00 |
| Gross Profit Ratio | 0.00% | 100.00% | 100.00% | 100.00% | 0.00% | 0.00% | 0.00% | 18.02% | 0.00% | 0.00% | 0.00% | 0.00% | 0.00% |
| Research & Development | 852.50K | 301.84K | 77.79K | -3.83K | 599.24K | 2.56M | 56.10K | 0.00 | 0.00 | 12.36K | 125.89K | 65.46K | 0.00 |
| General & Administrative | 629.23K | 1.67M | 1.78M | 1.52M | 1.80M | 2.63M | 1.18M | 1.27M | 1.14M | 1.17M | 851.57K | 1.20M | 204.22K |
| Selling & Marketing | 1.13M | 0.00 | 0.00 | 0.00 | 0.00 | 0.00 | 0.00 | 0.00 | 0.00 | 0.00 | 0.00 | 0.00 | 0.00 |
| SG&A | 1.75M | 1.67M | 1.78M | 1.52M | 1.80M | 2.63M | 1.18M | 1.27M | 1.14M | 1.17M | 851.57K | 1.20M | 204.22K |
| Other Expenses | 0.00 | 0.00 | 0.00 | 0.00 | 0.00 | 0.00 | 0.00 | 0.00 | 0.00 | 0.00 | 0.00 | 0.00 | 0.00 |
| Operating Expenses | 2.61M | 3.14M | 2.88M | 2.52M | 3.39M | 5.98M | 1.89M | 1.37M | 1.17M | 1.20M | 991.69K | 1.28M | 208.69K |
| Cost & Expenses | 2.61M | 3.14M | 2.88M | 2.52M | 3.39M | 5.98M | 1.89M | 2.23M | 1.17M | 1.20M | 991.69K | 1.28M | 208.69K |
| Interest Income | 0.00 | 0.00 | 0.00 | 0.00 | 0.00 | 0.00 | 0.00 | 0.00 | 0.00 | 0.00 | 0.00 | 0.00 | 0.00 |
| Interest Expense | 0.00 | 360.49K | 225.83K | 438.24K | 383.44K | 226.58K | 56.64K | 14.30K | 29.38K | 39.53K | 32.34K | 29.49K | 0.00 |
| Depreciation & Amortization | 979.34K | 1.04M | 940.16K | 953.74K | 736.86K | 622.72K | 536.41K | 90.73K | 29.44K | 21.95K | 14.23K | 12.79K | 4.47K |
| EBITDA | -2.87M | -1.24M | -2.11M | 3.64M | -2.61M | -5.29M | -1.35M | -1.11M | -1.14M | -1.18M | -977.46K | -1.27M | -204.22K |
| EBITDA Ratio | 0.00% | -95.04% | -27,362.55% | 69.97% | 0.00% | 0.00% | 0.00% | -103.37% | 0.00% | 0.00% | 0.00% | 0.00% | 0.00% |
| Operating Income | -2.61M | -2.24M | -2.96M | 2.69M | -3.39M | -5.98M | -3.61M | -1.21M | -1.25M | -1.25M | -1.03M | -1.30M | -208.69K |
| Operating Income Ratio | 0.00% | -177.33% | -40,082.94% | 51.64% | 0.00% | 0.00% | 0.00% | -115.47% | 0.00% | 0.00% | 0.00% | 0.00% | 0.00% |
| Total Other Income/Expenses | -2.27M | -1.81M | -393.64K | -1.54M | -571.26K | -849.30K | 1.66M | -127.06K | 0.00 | -66.08K | 0.00 | 0.00 | 0.00 |
| Income Before Tax | -4.88M | -2.64M | -3.27M | 2.09M | -3.77M | -6.20M | -1.94M | -1.21M | -1.25M | -1.25M | -1.03M | -1.30M | -208.69K |
| Income Before Tax Ratio | 0.00% | -208.50% | -44,257.12% | 40.19% | 0.00% | 0.00% | 0.00% | -115.47% | 0.00% | 0.00% | 0.00% | 0.00% | 0.00% |
| Income Tax Expense | 0.00 | -9.94K | 140.70K | 438.24K | 565.00K | 0.00 | 1.72M | 14.30K | 29.38K | 39.53K | 32.34K | 29.49K | 0.00 |
| Net Income | -4.88M | -2.64M | -3.27M | 2.09M | -3.77M | -6.20M | -1.94M | -1.21M | -1.25M | -1.25M | -1.03M | -1.30M | -208.69K |
| Net Income Ratio | 0.00% | -208.50% | -44,257.12% | 40.19% | 0.00% | 0.00% | 0.00% | -115.47% | 0.00% | 0.00% | 0.00% | 0.00% | 0.00% |
| EPS | -0.05 | -0.03 | -0.04 | 0.03 | -0.06 | -0.12 | -0.04 | -0.03 | -0.04 | -0.04 | -0.04 | -0.07 | -0.05 |
| EPS Diluted | -0.05 | -0.03 | -0.04 | 0.03 | -0.06 | -0.12 | -0.04 | -0.03 | -0.04 | -0.04 | -0.04 | -0.07 | -0.05 |
| Weighted Avg Shares Out | 90.10M | 82.88M | 77.06M | 66.79M | 58.22M | 52.44M | 45.38M | 41.77M | 34.72M | 28.34M | 23.17M | 17.49M | 4.55M |
| Weighted Avg Shares Out (Dil) | 90.10M | 82.88M | 77.06M | 66.79M | 58.22M | 52.44M | 45.38M | 41.77M | 34.72M | 28.34M | 23.17M | 17.49M | 4.55M |

Clean Seed Capital finalizes SMART Seeder sales following busy demonstration season

Clean Seed Capital announces Deerland Equipment takes on SMART Seeder MAX distribution

Clean Seed Capital announces retail sale order commitments for most of the model year 2022 production run

Clean Seed Capital applies to have its shares trade on the OTCQB Venture Market
Source: https://incomestatements.info
Category: Stock Reports
