See more : Alexion Pharmaceuticals, Inc. (0QZM.L) Income Statement Analysis – Financial Results
Complete financial analysis of Clearwater Paper Corporation (CLW) income statement, including revenue, profit margins, EPS and key performance metrics. Get detailed insights into the financial performance of Clearwater Paper Corporation, a leading company in the Paper, Lumber & Forest Products industry within the Basic Materials sector.
- Fortune Real Estate Investment Trust (0778.HK) Income Statement Analysis – Financial Results
- Lizhi Inc. (LIZI) Income Statement Analysis – Financial Results
- NightDragon Acquisition Corp. (NDACW) Income Statement Analysis – Financial Results
- Novavest Real Estate AG (NREN.SW) Income Statement Analysis – Financial Results
- Ragusa Minerals Limited (RAS.AX) Income Statement Analysis – Financial Results
Clearwater Paper Corporation (CLW)
Industry: Paper, Lumber & Forest Products
Sector: Basic Materials
Website: https://www.clearwaterpaper.com
About Clearwater Paper Corporation
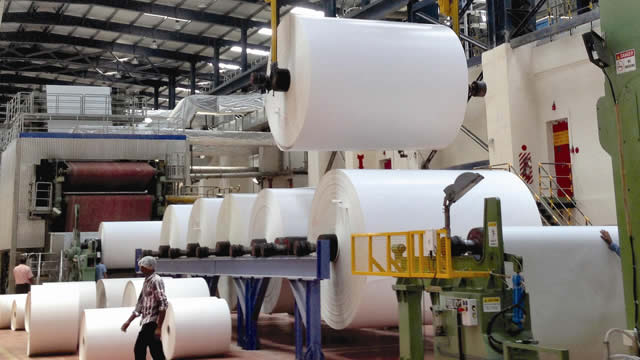
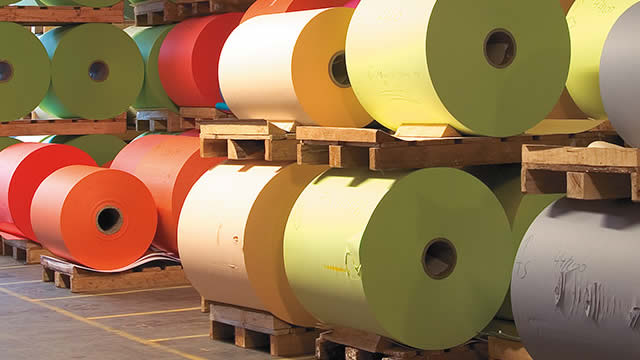
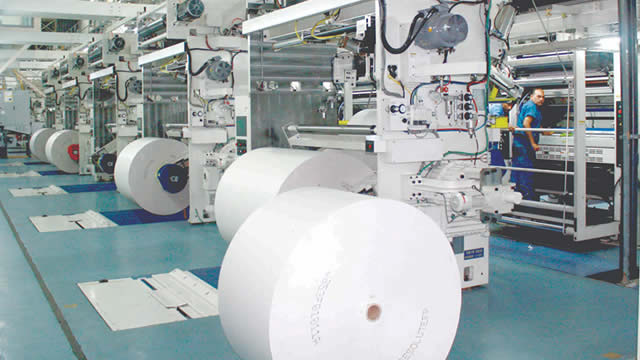
Clearwater Paper Corporation manufactures and supplies bleached paperboards, and consumer and parent roll tissues in the United States and internationally. It operates through two segments, Pulp and Paperboard, and Consumer Products. The Pulp and Paperboard segment offers folding cartons, liquid packaging, cups and plates, blister and carded packaging products, top sheet and commercial printing items, and softwood pulp products, as well as custom sheeting, slitting, and cutting of paperboard products. It sells its products to packaging converters, folding carton converters, merchants, and commercial printers. The Consumer Products segment provides a line of at-home tissue products, including bath tissues, paper towels, facial tissues, and napkins; recycled fiber value grade products; and away-from-home tissues. This segment sells its products to retailers and wholesale distributors, including grocery, club, mass merchants, and discount stores. Clearwater Paper Corporation was incorporated in 2005 and is headquartered in Spokane, Washington.
| Metric | 2023 | 2022 | 2021 | 2020 | 2019 | 2018 | 2017 | 2016 | 2015 | 2014 | 2013 | 2012 | 2011 | 2010 | 2009 | 2008 | 2007 | 2006 |
|---|---|---|---|---|---|---|---|---|---|---|---|---|---|---|---|---|---|---|
| Revenue | 2.08B | 2.08B | 1.77B | 1.87B | 1.76B | 1.72B | 1.73B | 1.73B | 1.75B | 1.97B | 1.89B | 1.87B | 1.93B | 1.37B | 1.25B | 1.26B | 1.17B | 1.11B |
| Cost of Revenue | 1.75B | 1.82B | 1.59B | 1.57B | 1.60B | 1.54B | 1.53B | 1.50B | 1.51B | 1.71B | 1.67B | 1.61B | 1.70B | 1.17B | 1.05B | 1.18B | 1.03B | 977.90M |
| Gross Profit | 330.80M | 256.70M | 182.60M | 294.20M | 164.50M | 186.21M | 200.79M | 239.14M | 239.55M | 258.30M | 218.46M | 266.43M | 225.44M | 199.16M | 197.92M | 75.91M | 140.23M | 128.78M |
| Gross Profit Ratio | 15.88% | 12.34% | 10.30% | 15.74% | 9.34% | 10.80% | 11.60% | 13.78% | 13.67% | 13.13% | 11.56% | 14.21% | 11.69% | 14.51% | 15.83% | 6.05% | 11.95% | 11.64% |
| Research & Development | 0.00 | 0.00 | 0.00 | 0.00 | 0.00 | 0.00 | 0.00 | 0.00 | 0.00 | 0.00 | 0.00 | 0.00 | 0.00 | 0.00 | 0.00 | 0.00 | 0.00 | 0.00 |
| General & Administrative | 149.20M | 133.90M | 114.00M | 124.90M | 113.10M | 112.99M | 128.46M | 129.57M | 117.15M | 130.10M | 119.13M | 121.05M | 110.00M | 100.39M | 71.13M | 47.43M | 0.00 | 0.00 |
| Selling & Marketing | 0.00 | -900.00K | -1.10M | 0.00 | -300.00K | 0.00 | 0.00 | 0.00 | 0.00 | 0.00 | 0.00 | 0.00 | 0.00 | 0.00 | 0.00 | 0.00 | 0.00 | 0.00 |
| SG&A | 149.20M | 133.00M | 112.90M | 124.90M | 112.80M | 112.99M | 128.46M | 129.57M | 117.15M | 130.10M | 119.13M | 121.05M | 110.00M | 100.39M | 71.13M | 47.43M | 36.13M | 36.28M |
| Other Expenses | 4.50M | 9.70M | 57.70M | 2.50M | 6.30M | -4.93M | 0.00 | 0.00 | 0.00 | 0.00 | 0.00 | 0.00 | 0.00 | 0.00 | 0.00 | 0.00 | 87.45M | 90.57M |
| Operating Expenses | 153.70M | 142.70M | 170.60M | 127.40M | 119.10M | 112.99M | 128.46M | 129.57M | 117.15M | 130.10M | 119.13M | 121.05M | 110.00M | 100.39M | 71.13M | 47.43M | 87.45M | 90.57M |
| Cost & Expenses | 1.91B | 1.97B | 1.76B | 1.70B | 1.72B | 1.65B | 1.66B | 1.63B | 1.63B | 1.84B | 1.79B | 1.73B | 1.81B | 1.27B | 1.12B | 1.23B | 1.12B | 1.07B |
| Interest Income | 2.40M | 1.00M | 600.00K | 46.50M | 44.80M | 0.00 | 0.00 | 0.00 | 0.00 | 0.00 | 0.00 | 0.00 | 0.00 | 0.00 | 0.00 | 0.00 | 0.00 | 0.00 |
| Interest Expense | 32.40M | 34.60M | 36.40M | 44.40M | 44.90M | 30.70M | 31.37M | 30.30M | 31.18M | 39.15M | 44.04M | 33.80M | 44.81M | 22.57M | 15.51M | 13.15M | 13.00M | 13.00M |
| Depreciation & Amortization | 98.60M | 103.30M | 105.10M | 113.50M | 116.60M | 101.95M | 101.29M | 91.09M | 84.73M | 90.15M | 90.27M | 79.33M | 76.93M | 47.73M | 47.42M | 46.95M | 51.33M | 54.29M |
| EBITDA | 275.30M | 219.70M | 106.40M | 258.20M | 153.60M | -689.00K | 173.62M | 202.06M | 208.40M | 233.14M | 195.58M | 224.72M | 192.66M | 146.50M | 338.61M | 75.44M | 104.10M | 100.55M |
| EBITDA Ratio | 13.22% | 10.17% | 6.02% | 14.35% | 8.82% | 9.87% | 10.25% | 11.57% | 11.82% | 11.10% | 10.03% | 7.76% | 5.99% | 7.19% | 22.05% | 6.01% | 8.87% | 9.12% |
| Operating Income | 177.10M | 113.90M | 1.70M | 158.10M | 45.40M | -97.91M | 72.33M | 111.32M | 123.67M | 79.81M | 99.33M | 145.39M | 115.45M | 98.77M | 297.44M | 28.48M | 52.78M | 38.21M |
| Operating Income Ratio | 8.50% | 5.48% | 0.10% | 8.46% | 2.58% | -5.68% | 4.18% | 6.42% | 7.06% | 4.06% | 5.26% | 7.76% | 5.99% | 7.19% | 23.79% | 2.27% | 4.50% | 3.45% |
| Total Other Income/Expenses | -32.90M | -40.80M | -47.70M | -59.90M | -53.30M | -35.56M | -31.37M | -34.10M | -31.18M | -63.57M | -61.09M | -33.80M | -44.53M | -22.57M | -21.76M | -13.15M | -13.00M | -4.52M |
| Income Before Tax | 144.20M | 73.10M | -35.70M | 98.20M | -7.90M | -133.46M | 40.95M | 80.67M | 92.49M | 16.24M | 38.23M | 111.59M | 70.92M | 76.20M | 275.69M | 15.34M | 39.78M | 33.69M |
| Income Before Tax Ratio | 6.92% | 3.51% | -2.01% | 5.26% | -0.45% | -7.74% | 2.37% | 4.65% | 5.28% | 0.83% | 2.02% | 5.95% | 3.68% | 5.55% | 22.05% | 1.22% | 3.39% | 3.04% |
| Income Tax Expense | 36.40M | 27.00M | -7.70M | 21.10M | -2.30M | 10.31M | -56.39M | 31.11M | 36.51M | 18.56M | -68.72M | 47.46M | 31.25M | 2.40M | 93.22M | 5.59M | 14.21M | 12.56M |
| Net Income | 107.70M | 46.00M | -28.00M | 77.10M | -5.60M | -143.77M | 97.34M | 49.55M | 55.98M | -2.32M | 106.96M | 64.13M | 39.67M | 73.80M | 182.46M | 9.74M | 25.57M | 21.13M |
| Net Income Ratio | 5.17% | 2.21% | -1.58% | 4.13% | -0.32% | -8.34% | 5.63% | 2.86% | 3.19% | -0.12% | 5.66% | 3.42% | 2.06% | 5.38% | 14.60% | 0.78% | 2.18% | 1.91% |
| EPS | 6.39 | 2.71 | -1.67 | 4.65 | -0.34 | -8.72 | 5.91 | 2.91 | 2.98 | -0.12 | 4.84 | 2.75 | 1.73 | 3.22 | 8.03 | 0.43 | 1.12 | 0.93 |
| EPS Diluted | 6.30 | 2.68 | -1.67 | 4.61 | -0.34 | -8.72 | 5.88 | 2.90 | 2.97 | -0.12 | 4.80 | 2.72 | 1.66 | 3.12 | 7.75 | 0.43 | 1.12 | 0.93 |
| Weighted Avg Shares Out | 16.86M | 16.99M | 16.77M | 16.57M | 16.47M | 16.49M | 16.46M | 17.00M | 18.76M | 20.13M | 22.08M | 23.30M | 22.91M | 22.95M | 22.72M | 22.71M | 22.71M | 22.71M |
| Weighted Avg Shares Out (Dil) | 17.09M | 17.18M | 16.77M | 16.72M | 16.53M | 16.49M | 16.56M | 17.11M | 18.82M | 20.13M | 22.26M | 23.61M | 23.95M | 23.67M | 23.54M | 22.71M | 22.71M | 22.71M |

Clearwater Paper Announces Participation at KeyBanc Capital Markets Industrials & Basic Materials Conference

5 Broker-Friendly Stocks to Tide Over the Market Doldrums

Swear on 5 Broker-Friendly Stocks to Weather Market Storms

These 4 Paper Stocks Are Going Strong

Here's Why Momentum Investors Will Love Clearwater Paper (CLW)

Will Clearwater Paper (CLW) Gain on Rising Earnings Estimates?

Should Value Investors Buy Clearwater Paper (CLW) Stock?

Clearwater Paper Corporation (CLW) CEO Arsen Kitch on Q1 2022 Results - Earnings Call Transcript

Clearwater Paper (CLW) Q1 Earnings Top Estimates

Clearwater Paper Reports First Quarter 2022 Results
Source: https://incomestatements.info
Category: Stock Reports
