See more : PJSC LUKOIL (LKOH.ME) Income Statement Analysis – Financial Results
Complete financial analysis of Condor Resources Inc. (CNRIF) income statement, including revenue, profit margins, EPS and key performance metrics. Get detailed insights into the financial performance of Condor Resources Inc., a leading company in the Other Precious Metals industry within the Basic Materials sector.
- Sivarom Real Estate Public Company Limited (SVR.BK) Income Statement Analysis – Financial Results
- Innovative Eyewear, Inc. (LUCY) Income Statement Analysis – Financial Results
- Jiangsu Hongtu High Technology Co., Ltd. (600122.SS) Income Statement Analysis – Financial Results
- Western Magnesium Corporation (MLYF) Income Statement Analysis – Financial Results
- iSIGN Media Solutions Inc. (ISDSF) Income Statement Analysis – Financial Results
Condor Resources Inc. (CNRIF)
About Condor Resources Inc.
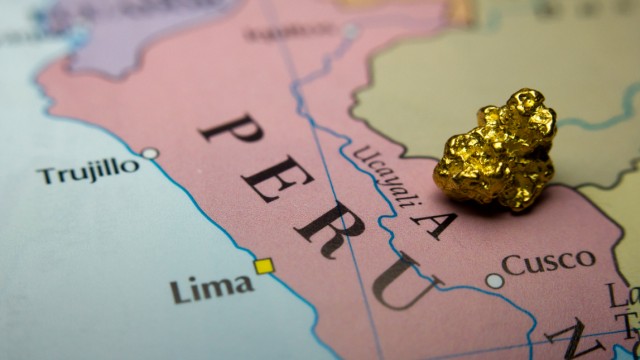
Condor Resources Inc., an exploration stage company, engages in the acquisition, exploration, and development of mineral properties in Peru. The company explores for gold, silver, copper, lead, and zinc deposits, as well as other precious and base metals. Its portfolio includes various projects, such as the Pucamayo, Chavin, Quriurqu, San Martin, Humaya, Huinac Punta, Andrea, Quilisane, Cobreorco, and Cantagallo. The company was incorporated in 2003 and is headquartered in Vancouver, Canada.
| Metric | 2024 | 2023 | 2022 | 2021 | 2020 | 2019 | 2018 | 2017 | 2016 | 2015 | 2014 | 2013 | 2012 | 2011 | 2010 | 2009 | 2008 | 2007 | 2006 | 2005 |
|---|---|---|---|---|---|---|---|---|---|---|---|---|---|---|---|---|---|---|---|---|
| Revenue | 0.00 | 0.00 | 0.00 | 0.00 | 0.00 | 0.00 | 0.00 | 0.00 | 0.00 | 0.00 | 0.00 | 0.00 | 0.00 | 0.00 | 0.00 | 0.00 | 0.00 | 0.00 | 0.00 | 0.00 |
| Cost of Revenue | 39.90K | 53.94 | 51.69 | 60.42 | 29.30 | 117.83 | 82.50 | 40.95 | 91.68 | 124.31 | 93.31 | 84.53 | 0.00 | 0.00 | 0.00 | 0.00 | 0.00 | 0.00 | 0.00 | 0.00 |
| Gross Profit | -39.90K | -53.94 | -51.69 | -60.42 | -29.30 | -117.83 | -82.50 | -40.95 | -91.68 | -124.31 | -93.31 | -84.53 | 0.00 | 0.00 | 0.00 | 0.00 | 0.00 | 0.00 | 0.00 | 0.00 |
| Gross Profit Ratio | 0.00% | 0.00% | 0.00% | 0.00% | 0.00% | 0.00% | 0.00% | 0.00% | 0.00% | 0.00% | 0.00% | 0.00% | 0.00% | 0.00% | 0.00% | 0.00% | 0.00% | 0.00% | 0.00% | 0.00% |
| Research & Development | 0.00 | 0.00 | 0.00 | 0.00 | 0.00 | 0.00 | 0.00 | 0.00 | 0.00 | 0.00 | 0.00 | 0.00 | 0.00 | 0.00 | 0.00 | 0.00 | 0.00 | 0.00 | 0.00 | 0.00 |
| General & Administrative | 318.26K | 684.23K | 254.01K | 545.96K | 260.65K | 269.71K | 557.81K | 316.62K | 213.20K | 377.58K | 449.98K | 753.00K | 2.03M | 1.11M | 1.05M | 1.51M | 0.00 | 0.00 | 0.00 | 0.00 |
| Selling & Marketing | -244.34K | 98.53K | 106.11K | 124.23K | 73.47K | 169.38K | 182.14K | 83.94K | 131.88K | 0.00 | 0.00 | 0.00 | 0.00 | 0.00 | 0.00 | 0.00 | 0.00 | 0.00 | 0.00 | 0.00 |
| SG&A | 73.92K | 782.76K | 360.12K | 670.19K | 334.12K | 439.08K | 739.95K | 400.55K | 345.08K | 377.58K | 449.98K | 753.00K | 2.03M | 1.11M | 1.05M | 1.51M | 1.32M | 1.07M | 178.13K | 24.97K |
| Other Expenses | 0.00 | 1.78M | 623.88K | 82.43K | 571.21K | 63.92K | -13.69K | 153.06K | 61.31K | 0.00 | 0.00 | 0.00 | 42.14K | 66.06K | -5.50K | 0.00 | -49.85K | 0.00 | 0.00 | 0.00 |
| Operating Expenses | 73.92K | 782.76K | 360.12K | 670.19K | 334.12K | 439.08K | 739.95K | 400.55K | 345.08K | 564.73K | 623.91K | 1.05M | 2.65M | 1.10M | 1.07M | 1.50M | 1.33M | 1.07M | 178.13K | 81.25K |
| Cost & Expenses | 113.82K | 782.76K | 360.12K | 670.19K | 334.12K | 439.08K | 739.95K | 400.55K | 345.08K | 564.73K | 623.91K | 1.05M | 2.65M | 1.10M | 1.07M | 1.50M | 1.33M | 1.07M | 178.13K | 81.25K |
| Interest Income | 44.54K | 0.00 | 530.00 | 3.19K | 0.00 | 1.07K | 4.59K | 0.00 | 0.00 | 3.17K | 4.65K | 17.74K | 47.07K | 29.58K | 14.74K | 103.30K | 0.00 | 0.00 | 0.00 | 0.00 |
| Interest Expense | 0.00 | 0.00 | 0.00 | 0.00 | 0.00 | 0.00 | 0.00 | 3.87K | 5.52K | 0.00 | 0.00 | 0.00 | 0.00 | 0.00 | 0.00 | 0.00 | 0.00 | 0.00 | 0.00 | 0.00 |
| Depreciation & Amortization | 30.47K | 389.61K | 48.08K | 627.04K | 318.04K | 1.00 | 673.79K | 1.37M | 1.37M | -2.56K | 215.63K | 356.00 | 2.94K | 5.70K | 8.72K | 12.44K | 10.80K | 0.00 | 0.00 | 0.00 |
| EBITDA | -113.82K | -228.48K | -215.35K | 0.00 | 0.00 | -415.28K | 0.00 | 990.08K | -287.77K | -561.56K | -408.28K | 1.43M | 972.14K | -562.24K | -1.06M | -842.63K | -973.30K | -1.07M | -178.13K | -81.25K |
| EBITDA Ratio | 0.00% | 0.00% | 0.00% | 0.00% | 0.00% | 0.00% | 0.00% | 0.00% | 0.00% | 0.00% | 0.00% | 0.00% | 0.00% | 0.00% | 0.00% | 0.00% | 0.00% | 0.00% | 0.00% | 0.00% |
| Operating Income | -113.82K | -782.76K | -360.12K | -670.19K | -334.12K | -439.08K | -739.95K | -400.55K | -345.08K | -559.00K | -623.91K | -1.06M | -2.66M | -1.10M | -1.07M | -1.50M | -1.67M | -1.07M | -178.13K | -81.25K |
| Operating Income Ratio | 0.00% | 0.00% | 0.00% | 0.00% | 0.00% | 0.00% | 0.00% | 0.00% | 0.00% | 0.00% | 0.00% | 0.00% | 0.00% | 0.00% | 0.00% | 0.00% | 0.00% | 0.00% | 0.00% | 0.00% |
| Total Other Income/Expenses | 1.34M | 680.23K | 479.65K | 2.96M | 196.88K | -22.48K | -76.84K | 130.10K | -1.28M | -387.38K | -210.97K | -91.43K | -3.57M | -462.54K | -5.50K | -649.38K | -392.96K | 0.00 | 0.00 | 0.00 |
| Income Before Tax | 1.22M | 439.41K | 119.53K | 2.33M | -121.16K | -437.77K | -750.64K | -246.94K | -1.63M | -946.38K | -834.88K | -3.52M | -6.23M | -1.56M | -1.07M | -2.15M | -2.06M | 0.00 | 0.00 | 0.00 |
| Income Before Tax Ratio | 0.00% | 0.00% | 0.00% | 0.00% | 0.00% | 0.00% | 0.00% | 0.00% | 0.00% | 0.00% | 0.00% | 0.00% | 0.00% | 0.00% | 0.00% | 0.00% | 0.00% | 0.00% | 0.00% | 0.00% |
| Income Tax Expense | 0.00 | -389.61 | -48.08 | -627.04 | -318.04 | -108.19K | -672.21K | -1.21M | -1.37K | 2.56K | -4.65K | 2.47M | 3.58M | 499.01K | -14.74K | 546.08K | 209.77K | 1.02M | 178.13K | 81.25K |
| Net Income | 1.22M | 439.41K | 119.53K | 2.33M | -121.16K | -437.77K | -750.64K | -246.94K | -1.63M | -946.38K | -834.88K | -3.52M | -6.23M | -1.53M | -1.06M | -2.05M | -1.59M | -1.02M | -178.13K | -81.25K |
| Net Income Ratio | 0.00% | 0.00% | 0.00% | 0.00% | 0.00% | 0.00% | 0.00% | 0.00% | 0.00% | 0.00% | 0.00% | 0.00% | 0.00% | 0.00% | 0.00% | 0.00% | 0.00% | 0.00% | 0.00% | 0.00% |
| EPS | 0.01 | 0.00 | 0.00 | 0.02 | 0.00 | 0.00 | -0.01 | 0.00 | -0.02 | -0.01 | -0.01 | -0.05 | -0.10 | -0.03 | -0.04 | -0.09 | -0.08 | -0.08 | -0.03 | -0.05 |
| EPS Diluted | 0.01 | 0.00 | 0.00 | 0.02 | 0.00 | 0.00 | -0.01 | 0.00 | -0.02 | -0.01 | -0.01 | -0.05 | -0.10 | -0.03 | -0.04 | -0.09 | -0.08 | -0.08 | -0.03 | -0.05 |
| Weighted Avg Shares Out | 136.90M | 126.88M | 125.87M | 117.57M | 104.86M | 103.62M | 101.46M | 89.78M | 85.28M | 80.99M | 72.61M | 67.28M | 61.41M | 51.60M | 29.27M | 24.00M | 19.48M | 12.29M | 6.26M | 1.77M |
| Weighted Avg Shares Out (Dil) | 136.90M | 126.88M | 125.87M | 117.57M | 104.86M | 103.62M | 101.46M | 89.78M | 85.28M | 80.99M | 72.61M | 67.28M | 61.41M | 51.60M | 29.27M | 24.00M | 19.48M | 12.29M | 6.26M | 1.77M |

Condor Resources to raise funds for exploration at Peru projects

Condor Resources Announces Life Offering Private Placement of up to $1.5 Million

Condor Resources adds to Peruvian silver prospect with additional concessions

Condor Resources expands silver property in Peru with additional concessions

Condor Resources to resume exploration at Soledad as Chakana deal falls through

Condor Resources Terminates Option Agreement on Soledad Project

Condor Resources CEO on key project updates for 2024 - ICYMI

Condor Resources CEO discusses Pucamayo milestones – ICYMI

Condor Resources signals progress at four Peru exploration projects

Condor Resources to drive growth through in-house exploration of its Peru project portfolio
Source: https://incomestatements.info
Category: Stock Reports
