See more : ECN Capital Corp. (ECN.TO) Income Statement Analysis – Financial Results
Complete financial analysis of Cowen Inc. – 7.75% Senior Notes (COWNL) income statement, including revenue, profit margins, EPS and key performance metrics. Get detailed insights into the financial performance of Cowen Inc. – 7.75% Senior Notes, a leading company in the industry within the sector.
You may be interested
- Anyang Iron and Steel Co., Ltd. (600569.SS) Income Statement Analysis – Financial Results
- RATIONAL Aktiengesellschaft (RAA.DE) Income Statement Analysis – Financial Results
- DCC plc (DCCPF) Income Statement Analysis – Financial Results
- Keppel Corporation Limited (KPELF) Income Statement Analysis – Financial Results
- Mitie Group plc (MITFF) Income Statement Analysis – Financial Results
Cowen Inc. - 7.75% Senior Notes (COWNL)
| Metric | 2022 | 2021 | 2020 | 2019 | 2018 | 2017 | 2016 | 2015 | 2014 | 2013 | 2012 | 2011 | 2010 | 2009 |
|---|---|---|---|---|---|---|---|---|---|---|---|---|---|---|
| Revenue | 1.54B | 2.11B | 1.62B | 1.05B | 966.92M | 658.78M | 471.57M | 464.57M | 427.78M | 327.25M | 240.48M | 235.28M | 233.81M | 123.90M |
| Cost of Revenue | 771.39M | 1.05B | 860.53M | 535.77M | 509.29M | 404.09M | 342.32M | 350.44M | 331.51M | 231.98M | 216.12M | 229.44M | 213.04M | 108.43M |
| Gross Profit | 766.34M | 1.07B | 762.77M | 513.67M | 457.63M | 254.69M | 129.24M | 114.13M | 96.27M | 95.27M | 24.36M | 5.84M | 20.77M | 15.47M |
| Gross Profit Ratio | 49.84% | 50.47% | 46.99% | 48.95% | 47.33% | 38.66% | 27.41% | 24.57% | 22.50% | 29.11% | 10.13% | 2.48% | 8.88% | 12.49% |
| Research & Development | 0.00 | 0.00 | 0.00 | 0.00 | 0.00 | 0.00 | 0.00 | 0.00 | 0.00 | 0.00 | 0.00 | 0.00 | 0.00 | 0.00 |
| General & Administrative | 80.69M | 430.25M | 0.00 | 535.77M | 509.29M | 404.09M | 310.04M | 321.39M | 305.48M | 207.25M | 194.03M | 203.77M | 17.64M | 26.64M |
| Selling & Marketing | 0.00 | 0.00 | 0.00 | 0.00 | 0.00 | 0.00 | 0.00 | 0.00 | 0.00 | 0.00 | 0.00 | 0.00 | 0.00 | 0.00 |
| SG&A | 80.69M | 430.25M | 0.00 | 535.77M | 509.29M | 404.09M | 310.04M | 321.39M | 305.48M | 207.25M | 194.03M | 203.77M | 17.64M | 26.64M |
| Other Expenses | 1.13B | 0.00 | -1.33B | 257.29M | 189.92M | 120.69M | 81.51M | 43.42M | 58.96M | 40.51M | 27.90M | 0.00 | 286.90M | 171.15M |
| Operating Expenses | 1.21B | 430.25M | -1.33B | 793.07M | 699.21M | 524.78M | 391.55M | 364.81M | 364.44M | 247.76M | 221.94M | 203.77M | 286.90M | 171.15M |
| Cost & Expenses | 1.21B | 430.25M | -1.33B | 948.86M | 887.61M | 757.60M | 547.12M | 504.37M | 490.19M | 360.92M | 326.90M | 203.77M | 230.68M | 135.07M |
| Interest Income | -10.60M | 8.38M | -9.30M | 31.24M | 40.40M | 0.00 | 0.00 | 0.00 | 0.00 | 0.00 | 0.00 | 0.00 | 0.00 | 0.00 |
| Interest Expense | 259.13M | 211.39M | -187.73M | 168.63M | 104.12M | 0.00 | 0.00 | 0.00 | 0.00 | 0.00 | 0.00 | 0.00 | 0.00 | 0.00 |
| Depreciation & Amortization | 27.73M | 211.39M | -187.73M | 26.19M | 19.06M | 21.77M | 20.81M | 15.80M | 14.87M | 10.23M | 9.44M | 26.86M | 11.54M | 5.76M |
| EBITDA | 335.77M | 617.42M | 109.71M | 65.67M | 77.60M | 4.95M | -17.56M | 12.03M | 57.15M | 15.33M | -14.00M | -101.22M | -53.09M | -47.25M |
| EBITDA Ratio | 21.84% | 29.22% | 6.76% | 6.26% | 8.03% | 0.75% | -3.72% | 2.59% | 13.36% | 4.68% | -5.82% | -43.02% | -22.71% | -38.13% |
| Operating Income | 308.04M | 406.03M | 297.44M | 70.72M | 98.94M | 6.96M | -31.49M | 11.48M | 57.84M | 18.30M | -23.89M | -98.61M | -53.09M | -47.25M |
| Operating Income Ratio | 20.03% | 19.22% | 18.32% | 6.74% | 10.23% | 1.06% | -6.68% | 2.47% | 13.52% | 5.59% | -9.93% | -41.91% | -22.71% | -38.13% |
| Total Other Income/Expenses | -265.23M | -230.15M | 0.00 | 0.00 | 0.00 | 0.00 | -136.39M | -76.42M | -19.09M | 457.00K | 0.00 | -20.07M | -56.22M | -36.08M |
| Income Before Tax | 76.64M | 406.03M | 297.44M | 70.72M | 98.94M | 6.96M | -31.49M | 11.48M | 57.84M | 18.30M | -23.96M | -98.61M | -53.09M | -47.25M |
| Income Before Tax Ratio | 4.98% | 19.22% | 18.32% | 6.74% | 10.23% | 1.06% | -6.68% | 2.47% | 13.52% | 5.59% | -9.96% | -41.91% | -22.71% | -38.13% |
| Income Tax Expense | 10.79M | 102.04M | 90.37M | 14.85M | 15.72M | 44.05M | -19.09M | -47.50M | -124.94M | 457.00K | 448.00K | -20.07M | -21.40M | -8.21M |
| Net Income | 65.86M | 303.99M | 207.06M | 24.63M | 42.82M | -60.88M | -19.28M | 43.73M | 167.22M | 4.65M | -23.89M | -108.01M | -31.69M | -39.04M |
| Net Income Ratio | 4.28% | 14.39% | 12.76% | 2.35% | 4.43% | -9.24% | -4.09% | 9.41% | 39.09% | 1.42% | -9.93% | -45.91% | -13.55% | -31.51% |
| EPS | 2.30 | 10.63 | 7.24 | 0.79 | 1.39 | -2.06 | -0.72 | 0.40 | 1.45 | 0.04 | -0.21 | -1.13 | -0.43 | -0.95 |
| EPS Diluted | 2.30 | 10.63 | 7.24 | 0.79 | 1.39 | -2.06 | -0.72 | 0.38 | 1.40 | 0.04 | -0.21 | -1.13 | -0.43 | -0.95 |
| Weighted Avg Shares Out | 28.60M | 28.60M | 28.60M | 31.29M | 30.74M | 29.49M | 26.86M | 110.09M | 114.93M | 116.70M | 114.40M | 95.53M | 73.15M | 41.00M |
| Weighted Avg Shares Out (Dil) | 28.60M | 28.60M | 28.60M | 31.29M | 30.74M | 29.49M | 26.86M | 116.17M | 119.49M | 121.12M | 114.40M | 95.53M | 73.15M | 41.00M |

Cowen Inc. (COWN) CEO Jeffrey Solomon on Q2 2020 Results - Earnings Call Transcript
Cowen Inc. (NASDAQ:COWN) Q2 2020 Earnings Conference Call July 28, 2020 09:00 AM ET Company Participants Jeffrey Solomon - Chairman and CEO Steve Lasota - CFO Conference Call Participants Steven Chubak - Wolfe Research Sumeet Mody - Piper Sandler Devin...

Cowen Inc. 2020 Q2 - Results - Earnings Call Presentation
The following slide deck was published by Cowen Inc. in conjunction with their 2020 Q2 earnings call..

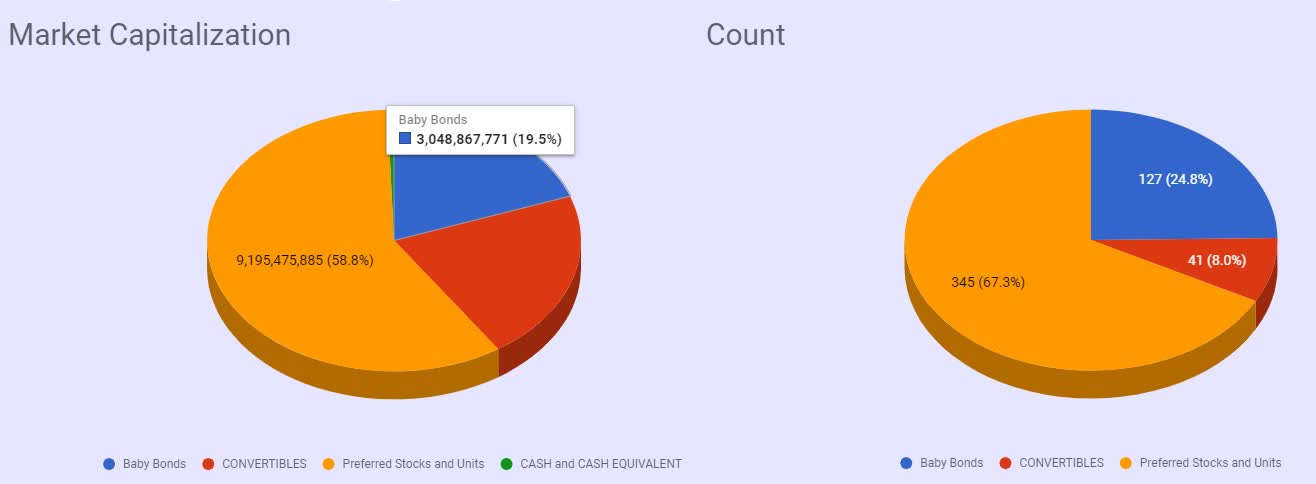
Baby Bonds Complete Review
A review of all baby bonds. All the baby bonds sorted in categories.

Alphabet Inc (NASDAQ:GOOG) Shares Acquired by Core Wealth Advisors Inc.
Core Wealth Advisors Inc. raised its stake in shares of Alphabet Inc (NASDAQ:GOOG) by 161.3% during the first quarter, according to its most recent filing with the Securities and Exchange Commission (SEC). The fund owned 209 shares of the information...

Conning Inc. Reduces Stock Holdings in Chevron Co. (NYSE:CVX)
Conning Inc. decreased its position in Chevron Co. (NYSE:CVX) by 2.1% during the 1st quarter, according to the company in its most recent disclosure with the Securities and Exchange Commission. The fund owned 29,031 shares of the oil and gas...

Q1 2021 Earnings Estimate for Alphabet Inc Issued By William Blair (NASDAQ:GOOG)
Alphabet Inc (NASDAQ:GOOG) – Research analysts at William Blair cut their Q1 2021 earnings per share (EPS) estimates for shares of Alphabet in a research report issued to clients and investors on Tuesday, April 28th. William Blair analyst R. Schackart...

Bruderman Asset Management LLC Sells 5,418 Shares of Verizon Communications Inc. (NYSE:VZ)
Bruderman Asset Management LLC lowered its position in Verizon Communications Inc. (NYSE:VZ) by 2.4% during the first quarter, according to its most recent 13F filing with the Securities and Exchange Commission (SEC). The institutional investor owned 223,438 shares of the...

Crossmark Global Holdings Inc. Buys 1,716 Shares of Cerner Co. (NASDAQ:CERN)
Crossmark Global Holdings Inc. boosted its stake in Cerner Co. (NASDAQ:CERN) by 7.4% in the first quarter, according to the company in its most recent 13F filing with the Securities and Exchange Commission. The firm owned 24,914 shares of the...

Eli Lilly And Co (NYSE:LLY) Shares Sold by Commerzbank Aktiengesellschaft FI
Commerzbank Aktiengesellschaft FI trimmed its stake in Eli Lilly And Co (NYSE:LLY) by 79.5% during the first quarter, according to its most recent filing with the Securities & Exchange Commission. The fund owned 4,546 shares of the company’s stock after...
Calamos Advisors LLC Sells 563,946 Shares of Exxon Mobil Co. (NYSE:XOM)
Calamos Advisors LLC lessened its position in Exxon Mobil Co. (NYSE:XOM) by 35.5% during the first quarter, according to the company in its most recent Form 13F filing with the Securities & Exchange Commission. The fund owned 1,022,934 shares of...
Source: https://incomestatements.info
Category: Stock Reports
