See more : Clean Earth Acquisitions Corp. (CLINR) Income Statement Analysis – Financial Results
Complete financial analysis of Capitala Finance Corp. (CPTA) income statement, including revenue, profit margins, EPS and key performance metrics. Get detailed insights into the financial performance of Capitala Finance Corp., a leading company in the Asset Management industry within the Financial Services sector.
- INTEKPLUS Co., Ltd. (064290.KQ) Income Statement Analysis – Financial Results
- PPL Corporation (PPL) Income Statement Analysis – Financial Results
- N1 Holdings Limited (N1H.AX) Income Statement Analysis – Financial Results
- Applied Energetics, Inc. (AERG) Income Statement Analysis – Financial Results
- Bossard Holding AG (BOSN.SW) Income Statement Analysis – Financial Results
Capitala Finance Corp. (CPTA)
About Capitala Finance Corp.
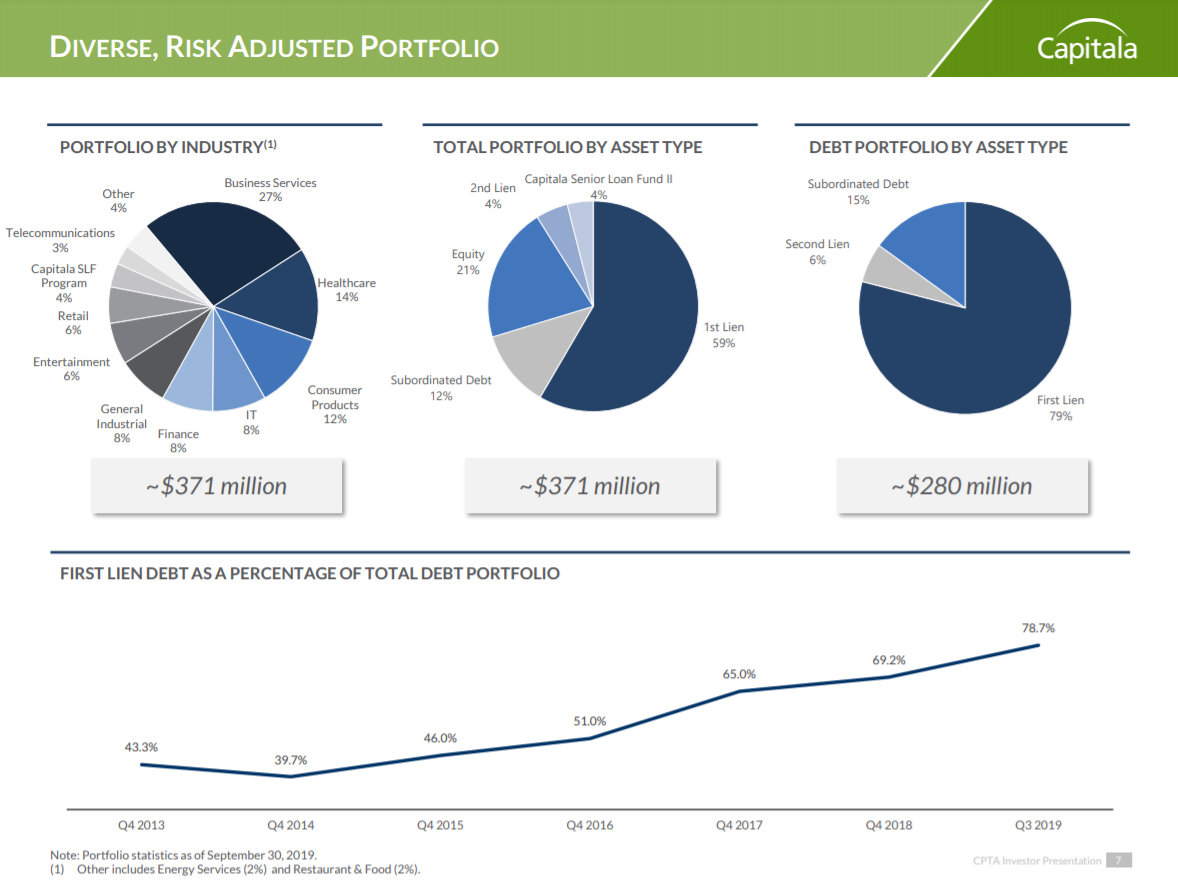
Capitala Finance Corp. is an externally managed non-diversified, closed-end management investment company. The Company's investment objective is to generate both current income and capital appreciation through debt and equity investments. The Company invests in first lien loans, which have a first priority security interest in all or some of the borrower’s assets. In addition, its first lien loans may include positions in stretch senior secured loans, also referred to as unitranche loans, which combine characteristics of traditional first lien senior secured loans and second lien loans. It also may invest in second lien loans, which have a second priority security interest in all or substantially all of the borrower’s assets. It also provides capital to lower and traditional middle-market companies in the United States. The Company’s investment advisor is Capitala Investment Advisors, LLC.
| Metric | 2020 | 2019 | 2018 | 2017 | 2016 | 2015 | 2014 | 2013 | 2012 | 2011 |
|---|---|---|---|---|---|---|---|---|---|---|
| Revenue | -30.79M | -22.61M | -13.25M | -43.00K | 11.28M | -47.13M | -48.91M | -5.60M | 24.60M | 25.92M |
| Cost of Revenue | 0.00 | 0.00 | 244.00K | 0.00 | 0.00 | 0.00 | 0.00 | 0.00 | 0.00 | 0.00 |
| Gross Profit | -30.79M | -22.61M | -13.49M | -43.00K | 11.28M | -47.13M | -48.91M | -5.60M | 24.60M | 25.92M |
| Gross Profit Ratio | 100.00% | 100.00% | 101.84% | 100.00% | 100.00% | 100.00% | 100.00% | 100.00% | 100.00% | 100.00% |
| Research & Development | 0.00 | 0.00 | 0.00 | 0.00 | 0.00 | 0.00 | 0.00 | 0.00 | 0.00 | 0.00 |
| General & Administrative | 4.82M | 4.70M | 4.70M | 6.61M | 3.80M | 4.05M | 4.30M | 1.31M | 119.00K | 585.00K |
| Selling & Marketing | 0.00 | 0.00 | 0.00 | 0.00 | 0.00 | 0.00 | 0.00 | 0.00 | 0.00 | 0.00 |
| SG&A | 4.82M | 4.70M | 4.70M | 6.61M | 3.80M | 4.05M | 4.30M | 1.31M | 119.00K | 585.00K |
| Other Expenses | -155.00K | -288.00K | 0.00 | -958.00K | -1.67M | -1.06M | -238.00K | -333.00K | -150.00K | 0.00 |
| Operating Expenses | 4.66M | 4.41M | 4.70M | 5.65M | 2.13M | 2.99M | 4.06M | 976.00K | -31.00K | 585.00K |
| Cost & Expenses | 4.66M | 4.41M | 13.99M | 14.97M | 21.23M | 20.69M | 16.43M | 7.57M | 4.31M | 585.00K |
| Interest Income | 0.00 | 0.00 | 0.00 | 0.00 | 0.00 | 0.00 | 0.00 | 0.00 | 0.00 | 0.00 |
| Interest Expense | 15.14M | 17.12M | 17.28M | 18.83M | 19.71M | 19.02M | 13.38M | 8.38M | 7.85M | 5.48M |
| Depreciation & Amortization | 206.30K | 171.86K | -33.96M | -22.99M | -18.22M | -10.42M | -23.17M | 9.37M | 36.80M | 0.00 |
| EBITDA | -20.30M | -9.90M | -659.00K | 13.13M | 28.86M | 32.87M | 9.94M | 37.24M | 57.42M | 30.81M |
| EBITDA Ratio | 65.95% | 43.77% | 4.97% | -30,534.88% | 255.81% | -69.74% | -20.31% | -665.15% | 233.43% | 118.87% |
| Operating Income | -20.30M | -9.90M | 33.31M | 36.12M | 47.08M | 43.29M | 33.10M | 27.87M | 20.63M | 30.81M |
| Operating Income Ratio | 65.95% | 43.77% | -251.42% | -84,006.98% | 417.25% | -91.85% | -67.68% | -497.73% | 83.85% | 118.87% |
| Total Other Income/Expenses | -15.14M | -17.12M | -51.25M | -41.82M | -37.93M | -29.44M | -36.54M | 990.00K | 28.94M | -5.48M |
| Income Before Tax | -35.45M | -27.02M | -17.94M | -5.70M | 9.15M | 13.85M | -3.44M | 28.86M | 49.57M | 25.34M |
| Income Before Tax Ratio | 115.14% | 119.49% | 135.44% | 13,244.19% | 81.11% | -29.39% | 7.03% | -515.41% | 201.50% | 97.74% |
| Income Tax Expense | 0.00 | 628.00K | -1.92M | 1.29M | 18.22M | 10.42M | 23.17M | -9.37M | -36.80M | 0.00 |
| Net Income | -35.45M | -27.65M | -16.03M | -6.98M | -9.06M | 3.43M | -26.61M | 38.23M | 86.37M | 25.34M |
| Net Income Ratio | 115.14% | 122.27% | 120.98% | 16,241.86% | -80.32% | -7.28% | 54.40% | -682.84% | 351.08% | 97.74% |
| EPS | -13.08 | -10.29 | -6.01 | -2.63 | -3.44 | 1.35 | -12.30 | 17.68 | 39.94 | 11.72 |
| EPS Diluted | -13.08 | -10.29 | -6.01 | -2.63 | -3.44 | 1.35 | -12.30 | 17.68 | 39.94 | 11.72 |
| Weighted Avg Shares Out | 2.71M | 2.69M | 2.67M | 2.65M | 2.64M | 2.54M | 2.16M | 2.16M | 2.16M | 2.16M |
| Weighted Avg Shares Out (Dil) | 2.71M | 2.69M | 2.67M | 2.65M | 2.64M | 2.54M | 2.16M | 2.16M | 2.16M | 2.16M |

Monthly Dividend Stock In Focus: Capitala Finance - Sure Dividend

Hercules Capital (HTGC) Q4 Earnings Beat on Higher Revenues

LendingClub (LC) Beats on Q4 Earnings, to Buy Radius Bank

Moody's (MCO) Beats on Q4 Earnings as Issuance Volume Rises

Capitala Group Hires Andrew Schwartz as VP of Accounting and Finance

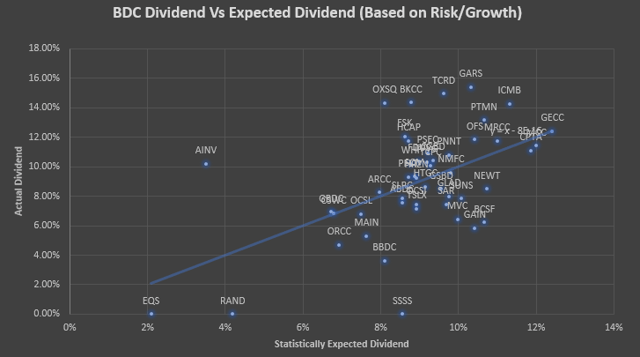
Ranking Business Development Companies From Most Undervalued To Overvalued

Capitala Group Announces Investment in J5 Infrastructure Partners, LLC

Capitala Group Makes Investment in Peterson Manufacturing

Capitala Group Makes Strategic Growth Investment in Source Support Services

Capitala Finance Corp. Announces Distributions
Source: https://incomestatements.info
Category: Stock Reports
