See more : Fortis Inc. (FORFF) Income Statement Analysis – Financial Results
Complete financial analysis of Carrefour SA (CRRFY) income statement, including revenue, profit margins, EPS and key performance metrics. Get detailed insights into the financial performance of Carrefour SA, a leading company in the Grocery Stores industry within the Consumer Defensive sector.
- Turnstone Biologics Corp. (TSBX) Income Statement Analysis – Financial Results
- Finlay Minerals Ltd. (FYMNF) Income Statement Analysis – Financial Results
- KBC Group NV (KBC.BR) Income Statement Analysis – Financial Results
- Tradeshow Marketing Company, Ltd. (TSHO) Income Statement Analysis – Financial Results
- KKR Acquisition Holdings I Corp. (KAHC) Income Statement Analysis – Financial Results
Carrefour SA (CRRFY)
About Carrefour SA
Carrefour SA operates stores in various formats and channels in France, Spain, Italy, Belgium, Poland, Romania, Brazil, Argentina, and Taiwan. The company operates hypermarkets, supermarkets, convenience stores, cash and carry stores, and hypercash stores; e-commerce sites; and service stations. Its stores offer fresh produce; local products; consumer goods; and non-food products, including electronic and household appliances, textiles, and childcare products. The company is also involved in banking, insurance, property development, and franchise activities; the provision of travel agency services; and the rental of shopping malls. As of December 31. 2021, it operated 253 hypermarkets, 1,043 supermarkets, 4,330 convenience stores, 147 cash and carry outlets, and 26 soft discount stores in France; 457 hypermarkets, 1,926 supermarkets, 3,430 convenience stores, 12 cash and carry outlets, and 81 soft discount stores in rest of Europe; 184 hypermarkets, 151 supermarkets, 558 convenience stores, 259 cash and carry outlets, and one soft discount store in Argentina and Brazil; and 70 hypermarkets, four supermarkets, and 274 convenience stores in Taiwan, as well as 688 stores through local franchisee partners in Middle East, Africa, etc. Carrefour SA was founded in 1959 and is based in Massy, France.
| Metric | 2023 | 2022 | 2021 | 2020 | 2019 | 2018 | 2017 | 2016 | 2015 | 2014 | 2013 | 2012 | 2011 | 2010 | 2009 | 2008 | 2007 | 2006 | 2005 | 2004 | 2003 | 2002 | 2001 | 2000 | 1999 | 1998 | 1997 | 1996 |
|---|---|---|---|---|---|---|---|---|---|---|---|---|---|---|---|---|---|---|---|---|---|---|---|---|---|---|---|---|
| Revenue | 84.91B | 83.09B | 74.29B | 72.15B | 74.14B | 77.92B | 80.98B | 78.77B | 78.86B | 76.32B | 76.68B | 78.46B | 80.46B | 91.51B | 87.38B | 86.97B | 82.15B | 77.90B | 74.50B | 72.67B | 70.49B | 68.73B | 69.49B | 64.80B | 37.36B | 27.41B | 25.81B | 1.00M |
| Cost of Revenue | 69.06B | 66.78B | 58.77B | 56.71B | 58.05B | 60.85B | 62.76B | 60.79B | 60.84B | 59.27B | 59.83B | 61.52B | 64.91B | 71.64B | 68.10B | 68.71B | 64.61B | 61.20B | 58.63B | 56.55B | 54.63B | 53.18B | 53.88B | 49.92B | 29.18B | 21.63B | 5.20B | 19.07B |
| Gross Profit | 15.85B | 16.31B | 15.52B | 15.45B | 16.09B | 17.07B | 18.22B | 17.99B | 18.02B | 17.05B | 16.85B | 16.94B | 15.54B | 19.87B | 19.28B | 18.26B | 17.54B | 16.70B | 15.87B | 16.11B | 15.86B | 15.55B | 15.61B | 14.88B | 8.18B | 5.78B | 20.60B | -19.07B |
| Gross Profit Ratio | 18.67% | 19.63% | 20.89% | 21.41% | 21.70% | 21.90% | 22.49% | 22.83% | 22.85% | 22.34% | 21.97% | 21.59% | 19.32% | 21.72% | 22.07% | 20.99% | 21.35% | 21.43% | 21.30% | 22.17% | 22.49% | 22.62% | 22.47% | 22.97% | 21.90% | 21.09% | 79.83% | -1,906,610.00% |
| Research & Development | 0.00 | 0.00 | 0.00 | 0.00 | 0.00 | 0.00 | 0.00 | 0.00 | 0.00 | 0.00 | 0.00 | 0.00 | 0.00 | 0.00 | 0.00 | 0.00 | 0.00 | 0.00 | 0.00 | 0.00 | 0.00 | 0.00 | 0.00 | 0.00 | 0.00 | 0.00 | 0.00 | 0.00 |
| General & Administrative | 2.90B | 2.60B | 2.01B | 2.09B | 2.29B | 2.15B | 1.52B | 1.57B | 2.56B | 1.48B | 1.40B | 1.46B | 13.97B | 14.98B | 14.63B | 14.35B | 13.67B | 12.89B | 12.23B | 11.79B | 11.48B | 11.42B | 11.73B | 11.24B | 5.96B | 4.25B | 3.85B | 3.38B |
| Selling & Marketing | 682.00M | 656.00M | 641.00M | 611.00M | 791.00M | 824.00M | 2.00B | 1.95B | 896.00M | 1.87B | 1.95B | 2.06B | 2.19B | 0.00 | 0.00 | 0.00 | 0.00 | 0.00 | 0.00 | 0.00 | 0.00 | 0.00 | 0.00 | 0.00 | 0.00 | 0.00 | 0.00 | 0.00 |
| SG&A | 11.06B | 3.25B | 2.65B | 2.70B | 3.08B | 12.28B | 3.51B | 3.51B | 3.46B | 3.36B | 3.35B | 3.52B | 13.97B | 14.98B | 14.63B | 14.35B | 13.67B | 12.89B | 12.23B | 11.79B | 11.48B | 11.42B | 11.73B | 11.24B | 5.96B | 4.25B | 3.85B | 3.38B |
| Other Expenses | 2.84B | 10.72B | 10.62B | 10.59B | 10.94B | 464.00M | 484.00M | 473.00M | 481.00M | 449.00M | 482.00M | 502.00M | -608.00M | -35.00M | -38.00M | -52.10M | -43.10M | -35.80M | -50.60M | -101.40M | -107.20M | -107.39M | -127.00M | -827.50M | -5.54B | -88.80M | -3.63B | -49.20M |
| Operating Expenses | 13.90B | 13.97B | 13.27B | 13.29B | 14.02B | 15.18B | 16.25B | 15.67B | 15.62B | 14.66B | 14.61B | 14.80B | 13.36B | 18.04B | 17.58B | 15.48B | 14.20B | 13.42B | 12.72B | 12.88B | 12.60B | 12.52B | 11.73B | 12.16B | 415.30M | 4.75B | 214.70M | -19.80B |
| Cost & Expenses | 83.16B | 80.75B | 72.04B | 69.99B | 72.07B | 76.03B | 79.01B | 76.46B | 76.46B | 73.93B | 74.44B | 76.32B | 78.27B | 89.68B | 85.67B | 84.19B | 78.81B | 74.63B | 71.34B | 69.43B | 67.23B | 65.70B | 65.60B | 62.08B | 29.60B | 26.38B | 5.42B | -730.50M |
| Interest Income | 117.00M | 23.00M | 2.00M | 6.00M | 9.00M | 16.00M | 27.00M | 34.00M | 36.00M | 37.00M | 46.00M | 59.00M | 54.00M | 166.00M | 147.00M | 383.00M | 0.00 | 0.00 | -51.50M | -82.60M | 0.00 | 0.00 | 0.00 | 0.00 | 0.00 | 0.00 | 0.00 | 0.00 |
| Interest Expense | 636.00M | 548.00M | 295.00M | 302.00M | 353.00M | 271.00M | 397.00M | 457.00M | 463.00M | 482.00M | 585.00M | 618.00M | 675.00M | 823.00M | 757.00M | 944.00M | 526.10M | 424.10M | 395.90M | 401.90M | 0.00 | 526.90M | 646.20M | 706.60M | 202.00M | 0.00 | 0.00 | 0.00 |
| Depreciation & Amortization | 2.30B | 2.24B | 2.11B | 2.29B | 2.32B | 1.47B | 1.60B | 1.54B | 1.57B | 1.45B | 1.48B | 1.61B | 1.80B | 2.03B | 1.98B | 1.95B | 1.79B | 1.67B | 1.56B | 2.10B | 2.07B | 1.95B | 368.50M | 326.20M | 1.32B | 74.60M | 745.30M | 50.80M |
| EBITDA | 4.34B | 4.79B | 3.98B | 3.96B | 3.43B | 3.36B | 3.72B | 3.87B | 3.99B | 3.80B | 3.69B | 3.68B | 1.47B | 4.44B | 3.77B | 4.72B | 5.13B | 4.91B | 4.66B | 5.34B | 5.32B | 4.98B | 3.19B | 3.05B | 9.08B | 1.11B | 21.13B | 782.30M |
| EBITDA Ratio | 5.11% | 5.68% | 6.05% | 5.98% | 5.91% | 4.44% | 3.57% | 4.84% | 5.08% | 5.00% | 4.65% | 4.69% | 8.25% | 4.41% | 4.39% | 5.43% | 6.24% | 6.27% | 6.25% | 7.34% | 7.54% | 7.24% | 4.60% | 4.71% | 24.31% | 4.03% | 81.89% | 78,230.00% |
| Operating Income | 1.75B | 2.46B | 1.91B | 1.69B | 2.06B | 758.00M | 700.00M | 1.94B | 2.23B | 2.57B | 2.38B | 1.43B | -481.00M | 1.84B | 1.71B | 2.78B | 3.34B | 3.27B | 3.15B | 3.23B | 3.25B | 3.03B | 2.83B | 2.73B | 7.77B | 1.03B | 20.39B | 731.50M |
| Operating Income Ratio | 2.06% | 2.96% | 2.57% | 2.34% | 2.77% | 0.97% | 0.86% | 2.47% | 2.83% | 3.37% | 3.11% | 1.83% | -0.60% | 2.01% | 1.95% | 3.19% | 4.06% | 4.20% | 4.23% | 4.45% | 4.61% | 4.40% | 4.07% | 4.21% | 20.78% | 3.76% | 79.00% | 73,150.00% |
| Total Other Income/Expenses | -410.00M | -490.00M | -270.00M | -335.00M | -352.00M | -258.00M | -445.00M | -515.00M | -515.00M | -563.00M | -722.00M | -884.00M | -705.00M | -657.00M | -610.00M | -561.00M | -526.10M | -473.60M | -454.60M | -484.50M | -463.70M | -526.89M | -646.20M | -706.60M | -6.32B | -84.90M | -19.44B | 67.00M |
| Income Before Tax | 1.34B | 1.97B | 1.63B | 1.35B | 722.00M | 496.00M | 255.00M | 1.43B | 1.72B | 2.01B | 1.66B | 552.00M | -1.24B | 1.18B | 1.10B | 2.21B | 2.81B | 2.79B | 2.70B | 2.81B | 2.79B | 2.50B | 2.18B | 2.02B | 1.29B | 982.50M | 944.00M | 798.50M |
| Income Before Tax Ratio | 1.58% | 2.37% | 2.20% | 1.87% | 0.97% | 0.64% | 0.31% | 1.81% | 2.18% | 2.63% | 2.16% | 0.70% | -1.54% | 1.29% | 1.25% | 2.55% | 3.42% | 3.59% | 3.62% | 3.87% | 3.95% | 3.64% | 3.14% | 3.11% | 3.46% | 3.58% | 3.66% | 79,850.00% |
| Income Tax Expense | 439.00M | 408.00M | 372.00M | 498.00M | 504.00M | 539.00M | 618.00M | 494.00M | 597.00M | 709.00M | 631.00M | 388.00M | 1.00B | 697.00M | 638.00M | 743.10M | 806.90M | 810.20M | 793.90M | 836.40M | 846.20M | 736.40M | 585.70M | 649.70M | 481.10M | 351.10M | 319.50M | 249.60M |
| Net Income | 1.66B | 1.35B | 1.07B | 641.00M | 218.00M | -561.00M | -531.00M | 746.00M | 980.00M | 1.25B | 1.26B | 1.26B | 371.00M | 433.00M | 437.00M | 1.27B | 2.30B | 2.27B | 1.44B | 1.70B | 1.63B | 1.37B | 1.27B | 1.07B | 755.20M | 631.40M | 546.20M | 548.90M |
| Net Income Ratio | 1.95% | 1.62% | 1.44% | 0.89% | 0.29% | -0.72% | -0.66% | 0.95% | 1.24% | 1.64% | 1.65% | 1.60% | 0.46% | 0.47% | 0.50% | 1.46% | 2.80% | 2.91% | 1.93% | 2.34% | 2.31% | 2.00% | 1.82% | 1.64% | 2.02% | 2.30% | 2.12% | 54,890.00% |
| EPS | 1.29 | 1.82 | 1.36 | 0.80 | 0.28 | -0.14 | -0.14 | 0.20 | 0.27 | 0.35 | 0.36 | 0.37 | 0.11 | 0.13 | 0.13 | 0.37 | 0.53 | 0.53 | 0.51 | 0.51 | 0.45 | 0.39 | 0.34 | 0.30 | 0.32 | 0.27 | 0.49 | 2.85 |
| EPS Diluted | 2.31 | 1.81 | 1.35 | 0.79 | 0.28 | -0.14 | -0.14 | 0.20 | 0.27 | 0.35 | 0.36 | 0.37 | 0.11 | 0.13 | 0.13 | 0.37 | 0.53 | 0.53 | 0.51 | 0.51 | 0.45 | 0.38 | 0.33 | 0.30 | 0.32 | 0.27 | 0.49 | 2.85 |
| Weighted Avg Shares Out | 1.29B | 741.38M | 786.95M | 805.71M | 790.67M | 3.88B | 3.78B | 3.70B | 3.62B | 3.54B | 3.47B | 3.41B | 3.30B | 3.39B | 3.43B | 3.43B | 3.50B | 3.52B | 3.50B | 3.49B | 3.58B | 3.56B | 3.56B | 3.55B | 2.52B | 2.31B | 1.15B | 192.31M |
| Weighted Avg Shares Out (Dil) | 719.23M | 746.62M | 791.41M | 807.59M | 791.58M | 3.88B | 3.78B | 3.70B | 3.62B | 3.54B | 3.47B | 3.42B | 3.30B | 3.39B | 3.43B | 3.43B | 3.50B | 3.52B | 3.50B | 3.49B | 3.64B | 3.67B | 3.67B | 3.55B | 2.52B | 2.31B | 1.15B | 192.31M |
French retailer Carrefour to freeze prices on 100 products to tackle inflation
Carrefour: Longer-Term Rebound Could Be Ahead
Belgium Drags Down Carrefour's European Profit But ‘Consumption Patterns' Prove Resilient
Brazil's Carrefour Brasil posts marginal rise in Q2 adjusted net profit
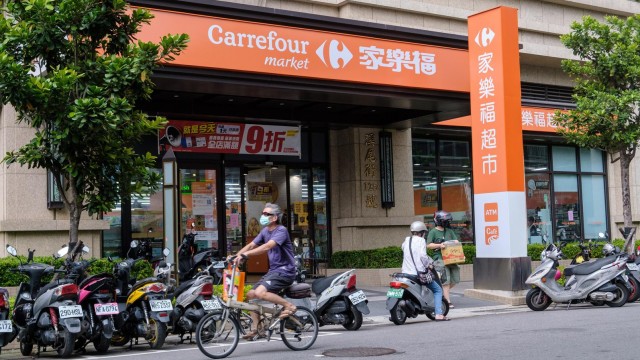
Carrefour Targets Brazil As It Sells Carrefour Taiwan To Uni-President

Exit from Taiwan lifts shares of French company Carrefour

Carrefour CEO says well placed to deal with sustained inflation
Carrefour has the financial means of its development - CEO
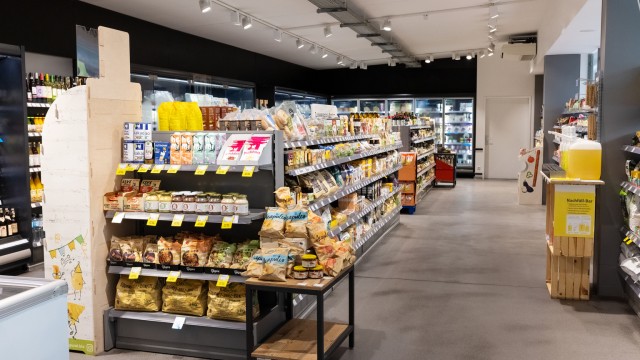
Carrefour: Potential Slowdown In Latin American Growth May Be A Risk Factor

Flink, the German instant grocery upstart, snaps up France's Cajoo for ~$93M, takes fresh Carrefour investment at a $5B valuation
Source: https://incomestatements.info
Category: Stock Reports
