See more : Maoye Commercial Co., Ltd. (600828.SS) Income Statement Analysis – Financial Results
Complete financial analysis of Cortexyme, Inc. (CRTX) income statement, including revenue, profit margins, EPS and key performance metrics. Get detailed insights into the financial performance of Cortexyme, Inc., a leading company in the Biotechnology industry within the Healthcare sector.
- NeuroSense Therapeutics Ltd. (NRSN) Income Statement Analysis – Financial Results
- Fujibo Holdings, Inc. (3104.T) Income Statement Analysis – Financial Results
- CuFe Ltd (CUF.AX) Income Statement Analysis – Financial Results
- Synopex Inc. (025320.KQ) Income Statement Analysis – Financial Results
- Igene Biotechnology, Inc. (IGNE) Income Statement Analysis – Financial Results
Cortexyme, Inc. (CRTX)
About Cortexyme, Inc.
Cortexyme, Inc., a clinical stage biopharmaceutical company, focuses on developing therapeutics for Alzheimer's and other degenerative diseases. Its lead drug candidate is atuzaginstat (COR388), an orally administered brain-penetrating small molecule gingipain inhibitor, which is in Phase II/III clinical trial for use in patients with mild to moderate Alzheimer's disease, as well as for the treatment of oral squamous cell carcinoma, periodontitis, and coronavirus infection. The company was incorporated in 2012 and is headquartered in South San Francisco, California.
| Metric | 2021 | 2020 | 2019 | 2018 | 2017 |
|---|---|---|---|---|---|
| Revenue | 0.00 | 0.00 | 0.00 | 0.00 | 0.00 |
| Cost of Revenue | 0.00 | 0.00 | 0.00 | 0.00 | 0.00 |
| Gross Profit | 0.00 | 0.00 | 0.00 | 0.00 | 0.00 |
| Gross Profit Ratio | 0.00% | 0.00% | 0.00% | 0.00% | 0.00% |
| Research & Development | 60.80M | 61.31M | 30.21M | 10.09M | 9.10M |
| General & Administrative | 29.52M | 17.59M | 8.95M | 2.03M | 1.27M |
| Selling & Marketing | 0.00 | 0.00 | 0.00 | 0.00 | 0.00 |
| SG&A | 29.52M | 17.59M | 8.95M | 2.03M | 1.27M |
| Other Expenses | 0.00 | 0.00 | 0.00 | 0.00 | 0.00 |
| Operating Expenses | 90.32M | 78.89M | 39.17M | 12.12M | 10.37M |
| Cost & Expenses | 90.32M | 78.89M | 39.17M | 12.12M | 10.37M |
| Interest Income | 620.00K | 2.04M | 2.19M | 806.00K | 0.00 |
| Interest Expense | 0.00 | 0.00 | 0.00 | 957.00K | 1.64M |
| Depreciation & Amortization | 344.00K | 332.00K | 188.00K | 51.00K | 45.00K |
| EBITDA | -90.32M | -78.89M | -39.17M | -11.47M | -10.55M |
| EBITDA Ratio | 0.00% | 0.00% | 0.00% | 0.00% | 0.00% |
| Operating Income | -89.95M | -78.89M | -39.17M | -12.12M | -10.37M |
| Operating Income Ratio | 0.00% | 0.00% | 0.00% | 0.00% | 0.00% |
| Total Other Income/Expenses | 373.00K | 2.04M | 2.19M | -357.00K | -1.87M |
| Income Before Tax | -89.95M | -76.85M | -36.98M | -12.48M | -12.24M |
| Income Before Tax Ratio | 0.00% | 0.00% | 0.00% | 0.00% | 0.00% |
| Income Tax Expense | 373.00K | 2.04M | 2.19M | 600.00K | -222.00K |
| Net Income | -89.95M | -76.85M | -36.98M | -12.48M | -12.24M |
| Net Income Ratio | 0.00% | 0.00% | 0.00% | 0.00% | 0.00% |
| EPS | -3.02 | -2.63 | -1.94 | -0.58 | -0.57 |
| EPS Diluted | -3.02 | -2.63 | -1.94 | -0.58 | -0.57 |
| Weighted Avg Shares Out | 29.77M | 29.18M | 19.06M | 21.55M | 21.55M |
| Weighted Avg Shares Out (Dil) | 29.77M | 29.18M | 19.06M | 21.55M | 21.55M |

Bristol Myers Squibb NDA, And Other News: The Good, Bad And Ugly Of Biopharma

Stocks To Watch: Big Focus On Big Tech

Cortexyme Announces Upcoming Data Presentations at the Alzheimer’s Association International Conference 2020

Legal & General Group Plc Trims Position in Cortexyme, Inc. (NASDAQ:CRTX)

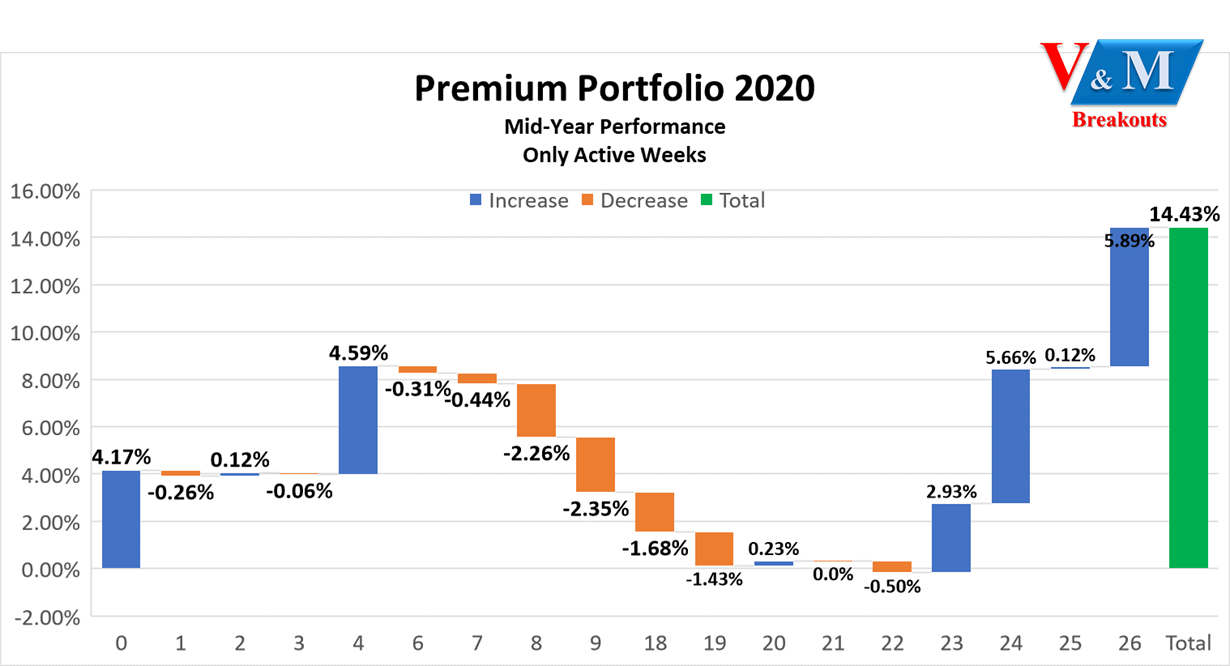
V&M Premium Portfolio: 2020 Mid-Year Report Card Through Week 26

HC Wainwright Initiates Coverage on Cortexyme (NASDAQ:CRTX)

Cortexyme (NASDAQ:CRTX) Stock Rating Lowered by Zacks Investment Research

Citigroup Inc. Has $158,000 Stock Holdings in Cortexyme, Inc. (NASDAQ:CRTX)

Insider Weekends: Director Of Accelerate Diagnostics Adds To His Stock

David Lamond Acquires 49,125 Shares of Cortexyme, Inc. (NASDAQ:CRTX) Stock
Source: https://incomestatements.info
Category: Stock Reports
