See more : Capricorn Energy PLC (CRNZF) Income Statement Analysis – Financial Results
Complete financial analysis of Corazon Mining Ltd (CRZNF) income statement, including revenue, profit margins, EPS and key performance metrics. Get detailed insights into the financial performance of Corazon Mining Ltd, a leading company in the Industrial Materials industry within the Basic Materials sector.
- Chaoda Modern Agriculture (Holdings) Limited (0682.HK) Income Statement Analysis – Financial Results
- Henan Thinker Automatic Equipment Co., Ltd. (603508.SS) Income Statement Analysis – Financial Results
- Impact HD Inc. (6067.T) Income Statement Analysis – Financial Results
- Baroque Japan Limited (3548.T) Income Statement Analysis – Financial Results
- RYAH Group, Inc. (RYAH.CN) Income Statement Analysis – Financial Results
Corazon Mining Ltd (CRZNF)
Industry: Industrial Materials
Sector: Basic Materials
About Corazon Mining Ltd
Corazon Mining Ltd explores and develops mineral resources such as nickel, copper, and gold and develops mining activities. The company's projects include the Lynn Lake Nickel-Copper-Sulphide project in Canada, the Mt Gilmore Cobalt-Copper-Gold project in Australia, and the Miriam Nickel-Copper Sulphide Project in Australia. The firm has two reportable segments based on the geographical areas of the mineral resource and exploration activities in Australia and Canada whereas it derives revenue from Australia.
| Metric | 2024 | 2023 | 2022 | 2021 | 2020 | 2019 | 2018 | 2017 | 2016 | 2015 | 2014 | 2013 | 2012 | 2011 | 2010 | 2009 | 2008 | 2007 | 2006 |
|---|---|---|---|---|---|---|---|---|---|---|---|---|---|---|---|---|---|---|---|
| Revenue | 0.00 | 0.00 | 0.00 | 21.69K | 0.00 | 0.00 | 0.00 | 0.00 | 0.00 | 0.00 | 0.00 | 0.00 | 30.00K | 10.74K | 0.00 | 0.00 | 0.00 | 10.39K | 0.00 |
| Cost of Revenue | 0.00 | 0.00 | 0.00 | 0.36 | 0.00 | 5.07K | 3.61K | 3.52K | 3.38K | 0.00 | 0.00 | 0.00 | 0.00 | 0.00 | 0.00 | 0.00 | 0.00 | 0.00 | 0.00 |
| Gross Profit | 0.00 | 0.00 | 0.00 | 21.68K | 0.00 | -5.07K | -3.61K | -3.52K | -3.38K | 0.00 | 0.00 | 0.00 | 30.00K | 10.74K | 0.00 | 0.00 | 0.00 | 10.39K | 0.00 |
| Gross Profit Ratio | 0.00% | 0.00% | 0.00% | 100.00% | 0.00% | 0.00% | 0.00% | 0.00% | 0.00% | 0.00% | 0.00% | 0.00% | 100.00% | 100.00% | 0.00% | 0.00% | 0.00% | 100.00% | 0.00% |
| Research & Development | 0.00 | 0.00 | 0.00 | 0.00 | 0.00 | 0.00 | 0.00 | 0.00 | 0.00 | 0.00 | 0.00 | 0.00 | 0.00 | 0.00 | 0.00 | 0.00 | 0.00 | 0.00 | 0.00 |
| General & Administrative | 0.00 | -148.78K | 531.65K | 634.46K | 487.81K | 514.59K | 314.01K | 943.56K | 118.20K | 293.73K | 443.32K | 505.67K | 657.77K | 1.06M | 334.00K | 1.30M | 1.79M | 461.46K | 0.00 |
| Selling & Marketing | 0.00 | 985.50K | 1.01M | 302.10K | 177.65K | 259.89K | 198.34K | 171.16K | 265.45K | 0.00 | 0.00 | 0.00 | 0.00 | 0.00 | 0.00 | 0.00 | 0.00 | 0.00 | 0.00 |
| SG&A | 960.96K | 836.73K | 1.54M | 936.56K | 665.45K | 774.49K | 512.34K | 1.11M | 383.65K | 293.73K | 443.32K | 505.67K | 657.77K | 1.06M | 334.00K | 1.30M | 1.79M | 461.46K | 0.00 |
| Other Expenses | 0.00 | 262.12K | 290.71 | 161.86K | 58.28K | 283.29K | -1.00K | -16.06K | 40.14K | 1.32M | 678.80K | -346.61K | 820.68K | 246.15K | 231.25K | 17.07K | 2.00K | 219.70K | -2.86M |
| Operating Expenses | 960.96K | 836.73K | 1.54M | 936.56K | 665.45K | 774.49K | 512.34K | 1.11M | 383.65K | 1.12M | 2.89M | 2.18M | 4.96M | 3.61M | 4.63M | 4.78M | 2.36M | 698.40K | -2.86M |
| Cost & Expenses | 960.96K | 836.73K | 1.54M | 936.56K | 665.45K | 779.56K | 515.95K | 1.12M | 387.04K | 1.12M | 2.89M | 2.18M | 4.96M | 3.61M | 4.63M | 4.78M | 2.36M | 698.40K | -2.86M |
| Interest Income | 16.32K | 41.04K | 10.34K | 811.51 | 1.05K | 1.44K | 1.76K | 1.47K | 15.10K | 42.31K | 47.52K | 31.96K | 82.15K | 43.18K | 26.93K | 90.12K | 126.00K | 84.76K | 0.00 |
| Interest Expense | 0.00 | 21.62K | 68.32K | 21.80K | 4.80K | -1.88K | 2.15K | -4.91K | 3.25K | 4.17K | 1.65K | 0.00 | 0.00 | 0.00 | 0.00 | 13.00 | 1.00K | 200.00 | 0.00 |
| Depreciation & Amortization | -1.71M | 252.70K | 332.11K | 315.29K | 297.67K | 7.23K | 4.88K | 4.59K | 4.54K | 5.56K | 6.72K | 9.16K | 12.23K | 16.06K | 14.54K | 22.68K | 12.00K | 3.71K | 0.00 |
| EBITDA | -2.67M | -836.72K | -1.54M | -914.88K | -665.45K | -774.48K | -512.34K | -1.11M | -383.66K | 251.57K | -2.16M | -1.14M | -4.92M | -3.58M | -4.62M | -4.65M | -2.22M | -379.85K | -2.86M |
| EBITDA Ratio | 0.00% | 0.00% | 0.00% | -4,218.88% | 0.00% | 0.00% | 0.00% | 0.00% | 0.00% | 0.00% | 0.00% | 0.00% | -10,695.86% | -33,383.93% | 0.00% | 0.00% | 0.00% | -3,656.29% | 0.00% |
| Operating Income | -960.96K | -836.72K | -1.54M | -914.88K | -665.45K | -779.55K | -515.95K | -1.12M | -387.04K | 246.01K | -2.16M | -1.15M | -3.22M | -3.60M | -4.63M | -4.67M | -2.23M | -383.56K | -2.86M |
| Operating Income Ratio | 0.00% | 0.00% | 0.00% | -4,218.88% | 0.00% | 0.00% | 0.00% | 0.00% | 0.00% | 0.00% | 0.00% | 0.00% | -10,736.62% | -33,533.54% | 0.00% | 0.00% | 0.00% | -3,691.95% | 0.00% |
| Total Other Income/Expenses | -1.71M | 162.21K | -36.60K | 84.28K | -803.63K | -1.58M | -1.01M | -3.70M | -334.34K | -158.96K | -137.49K | -2.37M | -2.51M | 289.33K | 258.18K | -13.00 | -1.00K | 304.26K | 0.00 |
| Income Before Tax | -2.67M | -674.52K | -1.57M | -830.60K | -1.77M | -2.36M | -1.53M | -4.82M | -721.38K | 87.06K | -2.30M | -3.52M | -5.73M | -3.31M | -4.37M | -4.67M | -2.23M | -383.76K | -2.86M |
| Income Before Tax Ratio | 0.00% | 0.00% | 0.00% | -3,830.22% | 0.00% | 0.00% | 0.00% | 0.00% | 0.00% | 0.00% | 0.00% | 0.00% | -19,116.38% | -30,838.30% | 0.00% | 0.00% | 0.00% | -3,693.88% | 0.00% |
| Income Tax Expense | -2.67M | -252.70K | -332.11K | -315.29K | -297.67K | -1.44K | -2.56 | -2.91 | -0.73 | 1.33M | 681.16K | 994.25K | 1.63M | -43.18K | -26.93K | 17.08K | 3.00K | 219.90K | 0.00 |
| Net Income | -2.67M | -674.52K | -1.57M | -830.60K | -1.77M | -2.36M | -1.53M | -4.82M | -721.38K | 87.06K | -2.30M | -3.52M | -5.73M | -3.31M | -4.37M | -4.67M | -2.23M | -383.76K | -2.86M |
| Net Income Ratio | 0.00% | 0.00% | 0.00% | -3,830.22% | 0.00% | 0.00% | 0.00% | 0.00% | 0.00% | 0.00% | 0.00% | 0.00% | -19,116.38% | -30,838.30% | 0.00% | 0.00% | 0.00% | -3,693.88% | 0.00% |
| EPS | 0.00 | 0.00 | 0.00 | 0.00 | -0.02 | -0.03 | -0.02 | -0.11 | -0.03 | 0.00 | -0.11 | -0.33 | -0.85 | -0.74 | -1.41 | -1.51 | -0.80 | -0.17 | -1.78 |
| EPS Diluted | 0.00 | 0.00 | 0.00 | 0.00 | -0.02 | -0.03 | -0.02 | -0.11 | -0.03 | 0.00 | -0.11 | -0.33 | -0.84 | -0.74 | -1.41 | -1.51 | -0.80 | -0.17 | -1.78 |
| Weighted Avg Shares Out | 615.64M | 610.33M | 603.75M | 192.58M | 112.72M | 71.89M | 61.97M | 43.44M | 24.77M | 22.92M | 20.83M | 10.65M | 6.77M | 4.46M | 3.09M | 3.09M | 2.80M | 2.21M | 1.60M |
| Weighted Avg Shares Out (Dil) | 615.64M | 610.33M | 603.75M | 192.58M | 112.72M | 71.89M | 61.97M | 43.44M | 24.77M | 22.92M | 20.83M | 10.65M | 6.83M | 4.46M | 3.09M | 3.09M | 2.80M | 2.21M | 1.60M |

Corazon Mining welcomes Delphi lifting stake to 19.99%, validates nickel sulphide strategy
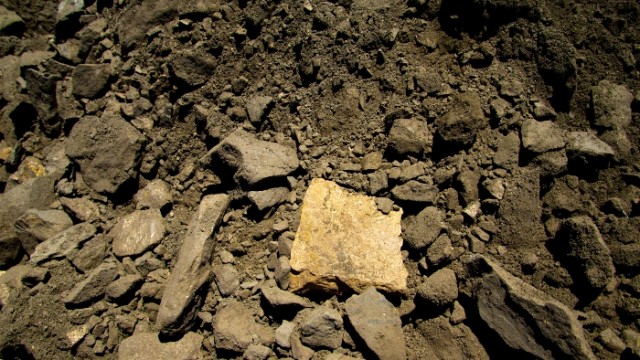
Corazon Mining heartened by prospects of massive sulphides at Fraser Lake Complex in Manitoba
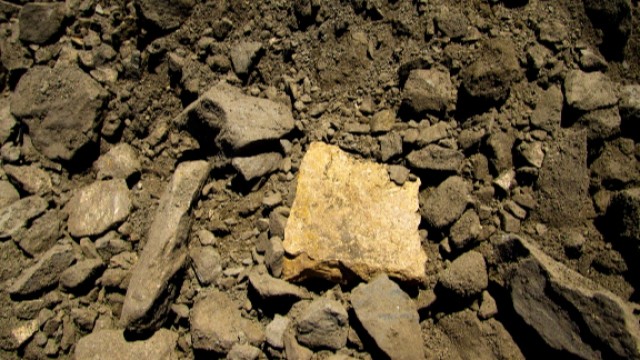
Corazon Mining confirms resource upgrade at Lynn Lake Nickel-Copper-Cobalt Sulphide Project in Canada

Corazon Mining exercises option to acquire strategic Miriam Nickel Sulphide Project in WA
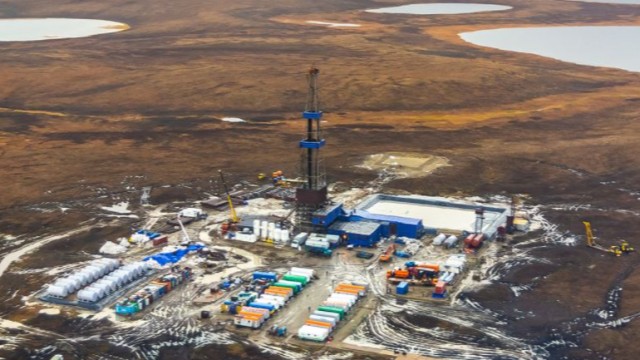
Corazon Mining kicks off new phase of drilling at Canadian nickel sulphide project

Corazon Mining in trading halt with capital raising announcement pending
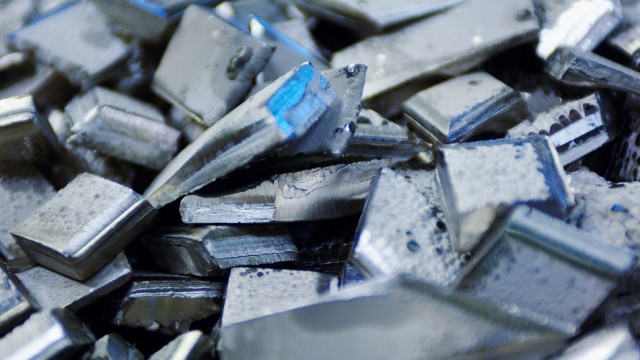
Corazon Mining looks to add to nickel sulphide assets through Miriam Project acquisition in Western Australia
Corazon Mining targets large porphyry system as drilling starts at Mt Gilmore Copper-Cobalt-Gold Project
Corazon Mining on path towards development with commencement of mining studies at Lynn Lake Nickel Project
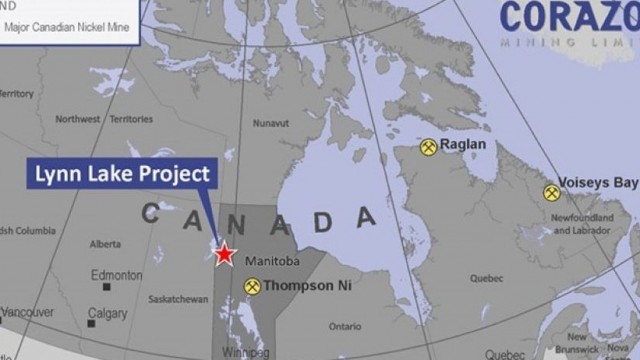
Corazon Mining downhole EM identifies multiple nickel-copper sulphide conductors at Lynn Lake Project
Source: https://incomestatements.info
Category: Stock Reports
