See more : Moderna, Inc. (0QF.F) Income Statement Analysis – Financial Results
Complete financial analysis of Chicken Soup for the Soul Entertainment, Inc. (CSSE) income statement, including revenue, profit margins, EPS and key performance metrics. Get detailed insights into the financial performance of Chicken Soup for the Soul Entertainment, Inc., a leading company in the Entertainment industry within the Communication Services sector.
- AFFIN Bank Berhad (5185.KL) Income Statement Analysis – Financial Results
- Metrics in Balance N.V. (MLMIB.PA) Income Statement Analysis – Financial Results
- Manati Industries, Inc. (MNII) Income Statement Analysis – Financial Results
- Blockchain Moon Acquisition Corp. (BMAQW) Income Statement Analysis – Financial Results
- Artisan Acquisition Corp. (ARTAU) Income Statement Analysis – Financial Results
Chicken Soup for the Soul Entertainment, Inc. (CSSE)
About Chicken Soup for the Soul Entertainment, Inc.
Chicken Soup for the Soul Entertainment, Inc. operates as a streaming video-on-demand (VOD) company in the United States and internationally. It owns and operates various ad-supported and subscription-based VOD networks, including Crackle, Chicken Soup for the Soul, Popcornflix, Popcornflix Kids, Truli, Pivotshare, Españolflix, and FrightPix. The company distributes and exhibits VOD content directly to consumers through various digital platforms, such as connected TVs, smartphones, tablets, gaming consoles, and the web through its owned and operated AVOD or FAST channel networks. It also produces and licenses movies, television series, and programs; and produces long and short-form original content. The company was founded in 2014 and is headquartered in Cos Cob, Connecticut. Chicken Soup for the Soul Entertainment, Inc. is a subsidiary of Chicken Soup for the Soul Productions, LLC.
| Metric | 2023 | 2022 | 2021 | 2020 | 2019 | 2018 | 2017 | 2016 |
|---|---|---|---|---|---|---|---|---|
| Revenue | 294.41M | 252.81M | 110.40M | 66.36M | 55.36M | 26.86M | 10.66M | 8.12M |
| Cost of Revenue | 343.36M | 215.82M | 79.14M | 52.14M | 40.42M | 12.35M | 4.74M | 3.16M |
| Gross Profit | -48.95M | 36.99M | 31.26M | 14.22M | 14.94M | 14.51M | 5.92M | 4.96M |
| Gross Profit Ratio | -16.63% | 14.63% | 28.31% | 21.43% | 26.99% | 54.04% | 55.56% | 61.13% |
| Research & Development | 0.00 | 0.00 | 0.00 | 0.00 | 0.00 | 0.00 | 0.00 | 0.00 |
| General & Administrative | 74.46M | 68.62M | 36.90M | 23.64M | 20.81M | 10.42M | 3.20M | 2.37M |
| Selling & Marketing | 108.22M | 24.92M | 0.00 | 1.38M | 1.05M | 0.00 | 0.00 | 0.00 |
| SG&A | 126.64M | 93.54M | 36.90M | 23.64M | 20.81M | 10.42M | 3.20M | 2.37M |
| Other Expenses | 3.84M | 254.94M | 27.78M | 29.28M | 18.83M | 2.99M | 1.07M | 811.86K |
| Operating Expenses | 126.64M | 348.48M | 64.69M | 52.93M | 39.64M | 13.41M | 4.26M | 3.18M |
| Cost & Expenses | 470.00M | 348.48M | 143.83M | 105.07M | 80.07M | 25.76M | 9.00M | 6.34M |
| Interest Income | 0.00 | 27.84M | 4.83M | 2.22M | 40.19K | 39.06K | 10.89K | 13.00 |
| Interest Expense | 71.36M | 27.84M | 4.34M | 2.09M | 728.62K | 330.87K | 1.19M | 519.21K |
| Depreciation & Amortization | 112.61M | 46.98M | 56.19M | 45.26M | 24.14M | 9.54M | 4.36M | 3.16M |
| EBITDA | -514.76M | -15.56M | 10.15M | 1.00M | -12.84M | 9.90M | 25.86M | 4.90M |
| EBITDA Ratio | -21.39% | -27.57% | 20.51% | 19.09% | -1.01% | 39.56% | 56.59% | 60.29% |
| Operating Income | -175.59M | -116.67M | -33.55M | -32.59M | -24.70M | 774.80K | 1.66M | 1.78M |
| Operating Income Ratio | -59.64% | -46.15% | -30.39% | -49.11% | -44.62% | 2.88% | 15.56% | 21.93% |
| Total Other Income/Expenses | -453.08M | -43.59M | -7.23M | -7.90M | -5.09M | -745.77K | 20.95M | -560.06K |
| Income Before Tax | -628.67M | -139.25M | -50.41M | -40.49M | -31.22M | 29.03K | 22.61M | 1.22M |
| Income Before Tax Ratio | -213.54% | -55.08% | -45.67% | -61.02% | -56.39% | 0.11% | 212.14% | 15.03% |
| Income Tax Expense | -5.70M | -37.30M | 66.00K | 99.00K | 585.00K | 874.00K | -182.00K | 439.00K |
| Net Income | -622.52M | -101.95M | -50.48M | -40.59M | -31.81M | -844.97K | 22.79M | 781.13K |
| Net Income Ratio | -211.45% | -40.33% | -45.73% | -61.17% | -57.45% | -3.15% | 213.85% | 9.62% |
| EPS | -21.87 | -5.91 | -3.36 | -3.30 | -2.65 | -0.07 | 2.02 | 0.07 |
| EPS Diluted | -21.87 | -5.91 | -3.36 | -3.30 | -2.65 | -0.07 | 1.99 | 0.07 |
| Weighted Avg Shares Out | 28.47M | 17.26M | 15.02M | 12.30M | 11.99M | 11.94M | 10.41M | 11.57M |
| Weighted Avg Shares Out (Dil) | 28.47M | 17.26M | 15.02M | 12.30M | 11.99M | 11.94M | 10.58M | 11.57M |

Why Chicken Soup for the Soul Entertainment Is Tumbling Today

Chicken Soup for the Soul Entertainment, Inc. (CSSE) CEO William Rouhana on Q2 2022 Results - Earnings Call Transcript

Chicken Soup for the Soul Entertainment, Inc. (CSSE) Reports Q2 Loss, Tops Revenue Estimates

Chicken Soup for the Soul Entertainment Reports Q2 2022 Results

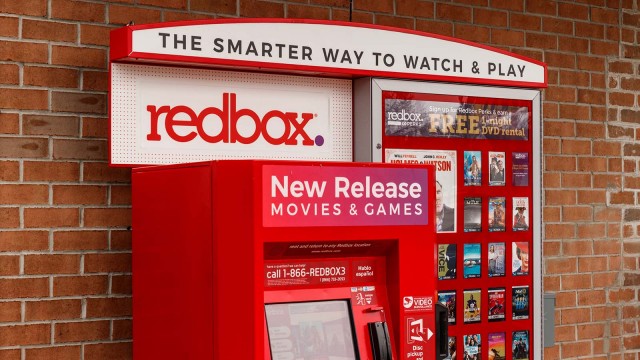
Chicken Soup for the Soul Entertainment (CSSE) Stock Pops as Redbox Deal Closes

Chicken Soup for the Soul says deal for Redbox is officially completed

Chicken Soup for the Soul Entertainment Completes Acquisition of Redbox Entertainment Inc.

Chicken Soup for the Soul Entertainment surges again as it closes deal to buy Redbox

Redbox Stockholders Approve Merger With Chicken Soup for the Soul Entertainment, Inc.

7 Short-Term Stocks to Buy for a Quick Profit
Source: https://incomestatements.info
Category: Stock Reports
