See more : Deyaar Development PJSC (DEYAAR.AE) Income Statement Analysis – Financial Results
Complete financial analysis of Catalent, Inc. (CTLT) income statement, including revenue, profit margins, EPS and key performance metrics. Get detailed insights into the financial performance of Catalent, Inc., a leading company in the Drug Manufacturers – Specialty & Generic industry within the Healthcare sector.
- Suncrest Bank (SBKK) Income Statement Analysis – Financial Results
- Hong Yi Fiber Ind. Co., Ltd. (1452.TW) Income Statement Analysis – Financial Results
- China Tianbao Group Development Company Limited (1427.HK) Income Statement Analysis – Financial Results
- Xiaomi Corporation (1810.HK) Income Statement Analysis – Financial Results
- Anteris Technologies Ltd (AMEUF) Income Statement Analysis – Financial Results
Catalent, Inc. (CTLT)
Industry: Drug Manufacturers - Specialty & Generic
Sector: Healthcare
Website: https://www.catalent.com
About Catalent, Inc.
Catalent, Inc., together with its subsidiaries, develops and manufactures solutions for drugs, protein-based biologics, cell and gene therapies, and consumer health products worldwide. It operates through four segments: Biologics, Softgel and Oral Technologies, Oral and Specialty Delivery, and Clinical Supply Services. The Softgel and Oral Technologies segment provides formulation, development, and manufacturing services for soft capsules for use in a range of customer products, such as prescription drugs, over-the-counter medications, dietary supplements, unit-dose cosmetics, and animal health medicinal preparations. The Biologics segment provides biologic cell-line; develops and manufactures cell therapy and viral based gene therapy; formulation, development, and manufacturing for parenteral dose forms, including vials, prefilled syringes, vials, and cartridges; and analytical development and testing services. The Oral and Specialty Delivery segment offers formulation, development, and manufacturing across a range of technologies along with integrated downstream clinical development and commercial supply solutions. This segment also offers oral delivery solutions platform comprising pre-clinical screening, formulation, analytical development, and current good manufacturing practices services. The Clinical Supply Services segment offers manufacturing, packaging, storage, distribution, and inventory management for drugs and biologics clinical trials. It also offers FastChain demand-led clinical supply services. The company serves pharmaceutical, biotechnology, and consumer health companies; and companies in other healthcare market segments, such as animal health and medical devices, as well as in cosmetics industries. Catalent, Inc. was incorporated in 2007 and is headquartered in Somerset, New Jersey.
| Metric | 2024 | 2023 | 2022 | 2021 | 2020 | 2019 | 2018 | 2017 | 2016 | 2015 | 2014 | 2013 | 2012 | 2011 |
|---|---|---|---|---|---|---|---|---|---|---|---|---|---|---|
| Revenue | 4.38B | 4.28B | 4.83B | 4.00B | 3.09B | 2.52B | 2.46B | 2.08B | 1.85B | 1.83B | 1.83B | 1.80B | 1.69B | 1.53B |
| Cost of Revenue | 3.43B | 3.22B | 3.19B | 2.65B | 2.11B | 1.71B | 1.71B | 1.42B | 1.26B | 1.22B | 1.23B | 1.23B | 1.14B | 1.03B |
| Gross Profit | 953.00M | 1.06B | 1.64B | 1.35B | 983.30M | 805.10M | 752.60M | 654.60M | 587.60M | 615.30M | 598.60M | 568.60M | 558.60M | 502.10M |
| Gross Profit Ratio | 21.75% | 24.79% | 33.97% | 33.82% | 31.78% | 31.97% | 30.55% | 31.54% | 31.79% | 33.61% | 32.75% | 31.58% | 32.96% | 32.78% |
| Research & Development | 0.00 | 18.00M | 23.00M | 21.00M | 63.80M | 54.50M | 52.50M | 52.80M | 55.00M | 53.50M | 51.50M | 49.50M | 0.00 | 0.00 |
| General & Administrative | 0.00 | 0.00 | 0.00 | 0.00 | 0.00 | 0.00 | 462.60M | 402.60M | 358.10M | 337.30M | 334.80M | 340.60M | 339.30M | 299.90M |
| Selling & Marketing | 0.00 | 0.00 | 0.00 | 0.00 | 0.00 | 0.00 | 0.00 | 0.00 | 0.00 | 0.00 | 0.00 | 0.00 | 0.00 | 0.00 |
| SG&A | 935.00M | 831.00M | 844.00M | 687.00M | 577.90M | 512.00M | 462.60M | 402.60M | 358.10M | 337.30M | 334.80M | 340.60M | 339.30M | 299.90M |
| Other Expenses | 767.00M | 6.00M | 41.00M | 19.00M | -7.90M | -2.70M | -7.70M | -8.50M | 15.60M | -42.40M | -10.40M | -25.10M | 3.80M | -26.00M |
| Operating Expenses | 1.70B | 987.00M | 885.00M | 706.00M | 577.90M | 512.00M | 462.60M | 402.60M | 358.10M | 337.30M | 334.80M | 340.60M | 339.30M | 299.90M |
| Cost & Expenses | 5.13B | 4.20B | 4.07B | 3.35B | 2.69B | 2.22B | 2.17B | 1.82B | 1.62B | 1.55B | 1.56B | 1.57B | 1.48B | 1.33B |
| Interest Income | 0.00 | 184.00M | 123.00M | 110.00M | 126.00M | 111.00M | 0.00 | 0.00 | 0.00 | 0.00 | 0.00 | 0.00 | 0.00 | 0.00 |
| Interest Expense | 254.00M | 184.00M | 123.00M | 110.00M | 126.10M | 110.90M | 111.40M | 90.10M | 88.50M | 105.00M | 163.10M | 203.20M | 183.20M | 165.50M |
| Depreciation & Amortization | 489.00M | 422.00M | 378.00M | 289.00M | 253.70M | 228.60M | 190.10M | 146.50M | 140.60M | 140.80M | 142.90M | 152.20M | 129.70M | 115.50M |
| EBITDA | -284.00M | 266.00M | 1.08B | 1.11B | 640.20M | 499.80M | 453.50M | 372.20M | 374.00M | 358.30M | 373.40M | 309.90M | 305.10M | 275.60M |
| EBITDA Ratio | -6.48% | 1.85% | 15.06% | 16.08% | 12.85% | 11.53% | 11.46% | 11.73% | 13.26% | 12.87% | 13.86% | 19.72% | 20.82% | 19.04% |
| Operating Income | -749.00M | -137.00M | 349.00M | 354.00M | 143.80M | 61.80M | 271.10M | 234.20M | 217.80M | 259.90M | 240.90M | 204.40M | 198.00M | 186.10M |
| Operating Income Ratio | -17.10% | -3.20% | 7.23% | 8.85% | 4.65% | 2.45% | 11.01% | 11.28% | 11.79% | 14.20% | 13.18% | 11.35% | 11.68% | 12.15% |
| Total Other Income/Expenses | -278.00M | -179.00M | -151.00M | -113.00M | -133.60M | -113.70M | -119.10M | -98.60M | -72.90M | -147.40M | -173.50M | -228.30M | -179.40M | -191.50M |
| Income Before Tax | -1.03B | -315.00M | 605.00M | 715.00M | 260.40M | 160.30M | 152.00M | 135.60M | 144.90M | 112.50M | 67.40M | -23.90M | 18.60M | -5.40M |
| Income Before Tax Ratio | -23.44% | -7.37% | 12.53% | 17.88% | 8.42% | 6.37% | 6.17% | 6.53% | 7.84% | 6.14% | 3.69% | -1.33% | 1.10% | -0.35% |
| Income Tax Expense | 16.00M | -83.00M | 86.00M | 130.00M | 39.70M | 22.90M | 68.40M | 25.80M | 33.70M | -97.70M | 49.50M | 24.10M | 500.00K | 23.70M |
| Net Income | -1.04B | -232.00M | 499.00M | 585.00M | 173.00M | 137.40M | 83.60M | 109.80M | 111.50M | 212.20M | 16.20M | -46.70M | -24.40M | -54.00M |
| Net Income Ratio | -23.81% | -5.43% | 10.34% | 14.63% | 5.59% | 5.46% | 3.39% | 5.29% | 6.03% | 11.59% | 0.89% | -2.59% | -1.44% | -3.53% |
| EPS | -5.76 | -1.28 | 2.74 | 3.15 | 1.15 | 0.95 | 0.64 | 0.88 | 0.89 | 1.77 | 0.14 | -0.40 | -0.21 | -0.46 |
| EPS Diluted | -5.76 | -1.28 | 2.71 | 3.11 | 1.14 | 0.94 | 0.63 | 0.87 | 0.89 | 1.75 | 0.14 | -0.40 | -0.21 | -0.46 |
| Weighted Avg Shares Out | 181.00M | 181.00M | 176.00M | 168.00M | 149.79M | 144.25M | 131.20M | 125.00M | 124.80M | 119.89M | 117.30M | 117.32M | 117.32M | 117.32M |
| Weighted Avg Shares Out (Dil) | 181.00M | 181.00M | 178.00M | 170.00M | 152.32M | 145.95M | 133.20M | 126.70M | 125.90M | 121.30M | 117.30M | 117.32M | 117.32M | 117.32M |

Catalent (CTLT) Reports Q1 Earnings: What Key Metrics Have to Say

Catalent (CTLT) Up on Encouraging Pre-Filled Syringe Potential

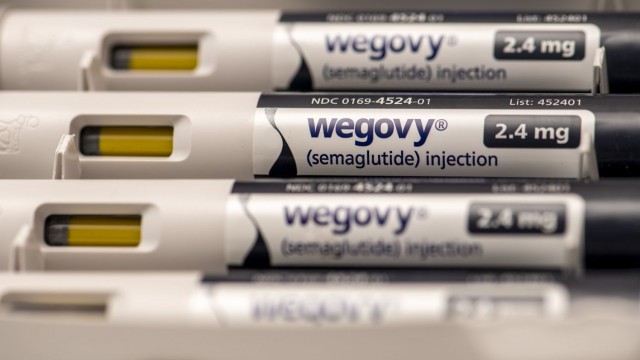
Syringe Maker Catalent Anticipates Boost From Demand for Injectable Weight-Loss Drugs

Catalent, Inc. (CTLT) Q1 2024 Earnings Call Transcript

Catalent doubles down on full year outlook as preliminary 1Q earnings beat estimates

Catalent beats quarterly revenue estimates

Catalent, Inc. Reports Preliminary First Quarter Fiscal 2024 Results and Reaffirms Full-Year Fiscal 2024 Guidance

Market Movers at Noon Tuesday: Catalent (CTLT), VF Corp (VFC), Arista (ANET), Leidos (LDOS)

Earnings Preview: Catalent (CTLT) Q1 Earnings Expected to Decline

Catalent, Inc. Announces First Quarter Fiscal Year 2024 Earnings Conference Webcast
Source: https://incomestatements.info
Category: Stock Reports
