See more : Acer Cyber Security Inc. (6690.TWO) Income Statement Analysis – Financial Results
Complete financial analysis of Customers Bancorp, Inc 5.375% S (CUBB) income statement, including revenue, profit margins, EPS and key performance metrics. Get detailed insights into the financial performance of Customers Bancorp, Inc 5.375% S, a leading company in the Banks – Regional industry within the Financial Services sector.
- Chugai Pharmaceutical Co., Ltd. (CHGCY) Income Statement Analysis – Financial Results
- OK Science and Technology Co., Ltd. (001223.SZ) Income Statement Analysis – Financial Results
- Compagnie de l’Odet (ODET.PA) Income Statement Analysis – Financial Results
- LPI Capital Bhd (8621.KL) Income Statement Analysis – Financial Results
- Suzhou Hengmingda Electronic Technology Co., Ltd. (002947.SZ) Income Statement Analysis – Financial Results
Customers Bancorp, Inc 5.375% S (CUBB)
About Customers Bancorp, Inc 5.375% S
Customers Bancorp, Inc. engages in the provision of banking services through its subsidiary, Customers Bank. The firm also provides banking products such as loans and deposits to businesses and consumers through its branches, limited production, and administrative offices. The company was founded in 1997 and is headquartered in Malvern, PA.
| Metric | 2023 | 2022 | 2021 | 2020 | 2019 | 2018 | 2017 | 2016 | 2015 | 2014 | 2013 | 2012 |
|---|---|---|---|---|---|---|---|---|---|---|---|---|
| Revenue | 683.40M | 885.37M | 780.88M | 543.30M | 463.74M | 417.95M | 372.85M | 322.54M | 203.44M | 162.30M | 124.32M | 86.74M |
| Cost of Revenue | -683.96M | 0.00 | 0.00 | 0.00 | 0.00 | 0.00 | 0.00 | 0.00 | -46.41M | -28.13M | -3.19M | 0.00 |
| Gross Profit | 1.37B | 885.37M | 780.88M | 543.30M | 463.74M | 417.95M | 372.85M | 322.54M | 249.85M | 190.43M | 127.52M | 86.74M |
| Gross Profit Ratio | 200.08% | 100.00% | 100.00% | 100.00% | 100.00% | 100.00% | 100.00% | 100.00% | 122.81% | 117.33% | 102.57% | 100.00% |
| Research & Development | 0.00 | 0.00 | 0.00 | 0.00 | 0.00 | 0.00 | 0.00 | 0.00 | 0.00 | 0.00 | 0.00 | 0.00 |
| General & Administrative | 273.97M | 112.46M | 110.23M | 64.22M | 55.70M | 64.69M | 73.94M | 43.62M | 21.64M | 15.68M | 12.16M | 6.27M |
| Selling & Marketing | 3.10M | 2.54M | 1.52M | 2.22M | 4.04M | 2.45M | 1.47M | 576.00K | 1.48M | 1.18M | 1.27M | 1.22M |
| SG&A | 277.07M | 2.54M | 1.52M | 2.22M | 4.04M | 2.45M | 1.47M | 576.00K | 90.56M | 71.01M | 55.47M | 38.15M |
| Other Expenses | 0.00 | -156.44M | -426.62M | -367.35M | -81.95M | -82.07M | -94.08M | -79.15M | 0.00 | 0.00 | 0.00 | 0.00 |
| Operating Expenses | 277.07M | 2.54M | -426.62M | -367.35M | 4.04M | 2.45M | 1.47M | 576.00K | 114.95M | 96.79M | 74.02M | 50.65M |
| Cost & Expenses | 277.07M | 2.54M | -426.62M | -367.35M | 4.04M | 2.45M | 1.47M | 576.00K | 114.95M | 96.79M | 74.02M | 50.65M |
| Interest Income | 70.57M | 32.27M | 77.87M | 0.00 | 80.94M | 59.00M | 78.91M | 23.17M | 27.72M | 25.13M | 23.34M | 0.00 |
| Interest Expense | 679.91M | 261.65M | 95.81M | 0.00 | 186.43M | 160.07M | 105.51M | 73.02M | 53.56M | 38.50M | 24.30M | 0.00 |
| Depreciation & Amortization | 29.90M | 22.98M | 21.67M | 18.51M | 22.88M | 14.16M | 10.80M | 5.90M | -101.74M | -80.23M | -59.23M | -40.48M |
| EBITDA | 360.64M | 314.28M | 462.88M | 208.27M | 125.00M | 105.21M | 134.68M | 130.49M | -4.90M | -16.84M | -8.93M | -4.39M |
| EBITDA Ratio | 52.77% | 25.76% | 68.77% | 6.69% | 22.02% | 21.79% | 33.22% | 27.19% | -7.74% | -9.07% | -7.19% | -5.06% |
| Operating Income | 406.34M | 552.95M | 354.27M | 175.96M | 102.12M | 91.05M | 123.88M | 87.71M | 101.74M | 80.23M | 59.23M | 40.48M |
| Operating Income Ratio | 59.46% | 62.45% | 45.37% | 32.39% | 22.02% | 21.79% | 33.22% | 27.19% | 50.01% | 49.43% | 47.64% | 46.67% |
| Total Other Income/Expenses | -75.60M | -1.35M | -10.06M | -13.03M | -11.47M | -13.48M | -8.89M | -20.15M | -13.24M | -16.84M | -8.93M | -4.39M |
| Income Before Tax | 330.74M | 291.30M | 441.21M | 175.96M | 102.12M | 91.05M | 123.88M | 139.12M | 88.50M | 65.51M | 50.30M | 36.09M |
| Income Before Tax Ratio | 48.40% | 32.90% | 56.50% | 32.39% | 22.02% | 21.79% | 33.22% | 43.13% | 43.50% | 40.37% | 40.46% | 41.61% |
| Income Tax Expense | 80.60M | -324.92M | 10.06M | 43.38M | 22.79M | 19.36M | 45.04M | 51.41M | 29.91M | 20.98M | 17.60M | 12.27M |
| Net Income | 250.14M | 616.21M | 431.15M | 132.58M | 79.33M | 71.70M | 78.84M | 78.70M | 56.09M | 44.53M | 32.69M | 23.82M |
| Net Income Ratio | 36.60% | 69.60% | 55.21% | 24.40% | 17.11% | 17.15% | 21.14% | 24.40% | 27.57% | 27.44% | 26.30% | 27.46% |
| EPS | 7.49 | 18.88 | 13.34 | 4.21 | 2.54 | 2.27 | 2.57 | 2.85 | 1.96 | 1.59 | 1.30 | 1.57 |
| EPS Diluted | 7.32 | 18.37 | 12.79 | 4.18 | 2.51 | 2.22 | 2.42 | 2.62 | 1.96 | 1.59 | 1.30 | 1.57 |
| Weighted Avg Shares Out | 31.44M | 32.63M | 32.31M | 31.51M | 31.18M | 31.57M | 30.66M | 27.60M | 28.62M | 28.01M | 25.15M | 15.17M |
| Weighted Avg Shares Out (Dil) | 32.16M | 33.55M | 33.70M | 31.73M | 31.65M | 32.23M | 32.60M | 30.01M | 28.68M | 27.94M | 25.15M | 15.17M |
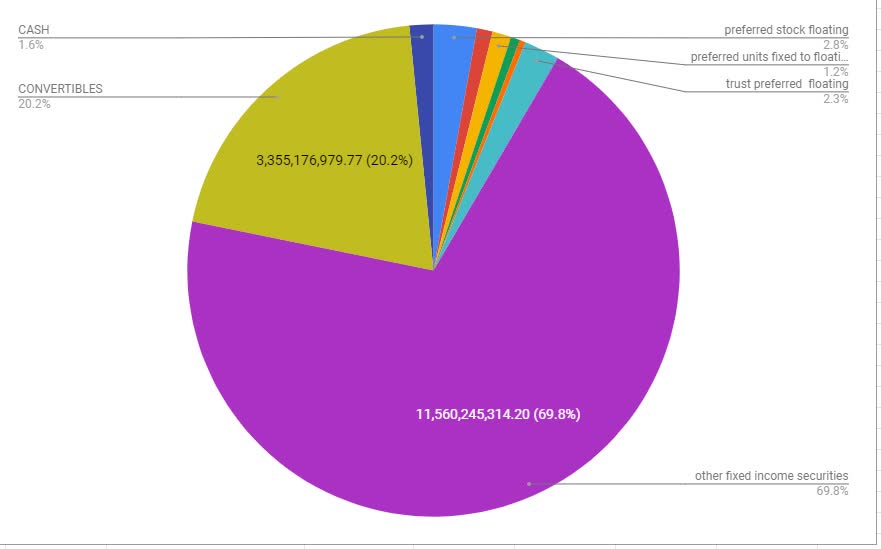
Not So Common Fixed Income Preview

Customers Bancorp, Inc. (CUBI) CEO Jay Sidhu on Q2 2020 Results - Earnings Call Transcript
Customers Bancorp, Inc. 2020 Q2 - Results - Earnings Call Presentation
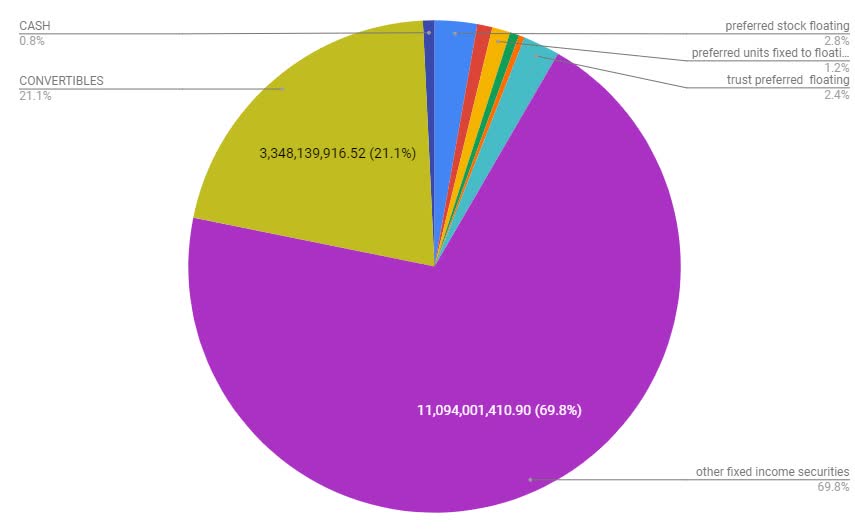
Not So Common Fixed Income Preview
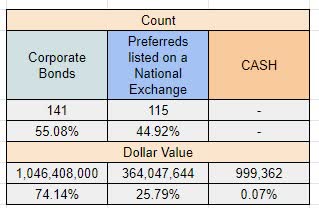
Fixed-To-Floating Preferred Stocks And Units Complete Review
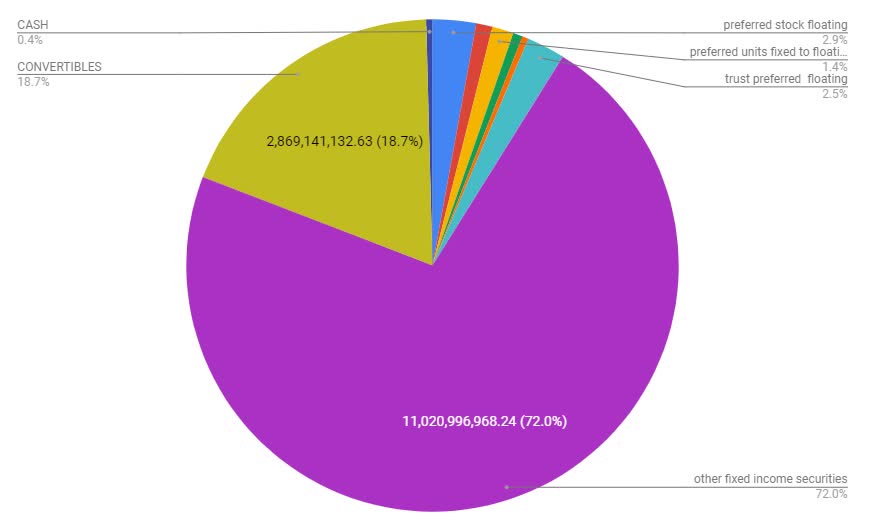
Not So Common Fixed-Income Preview
Source: https://incomestatements.info
Category: Stock Reports
