See more : Nouveau Holdings, Ltd. (NHLI) Income Statement Analysis – Financial Results
Complete financial analysis of Crown Resorts Limited (CWLDY) income statement, including revenue, profit margins, EPS and key performance metrics. Get detailed insights into the financial performance of Crown Resorts Limited, a leading company in the Gambling, Resorts & Casinos industry within the Consumer Cyclical sector.
- Bhilwara Technical Textiles Limited (BTTL.BO) Income Statement Analysis – Financial Results
- First Internet Bancorp – Fixed- (INBKZ) Income Statement Analysis – Financial Results
- Immune Therapeutics, Inc. (IMUN) Income Statement Analysis – Financial Results
- AV Concept Holdings Limited (0595.HK) Income Statement Analysis – Financial Results
- Maja Agung Latexindo Tbk. (SURI.JK) Income Statement Analysis – Financial Results
Crown Resorts Limited (CWLDY)
Industry: Gambling, Resorts & Casinos
Sector: Consumer Cyclical
Website: https://www.crownresorts.com.au
About Crown Resorts Limited
Crown Resorts Limited operates in the entertainment industry primarily in Australia. It operates through four segments: Crown Melbourne, Crown Perth, Crown Aspinalls, and Wagering & Online. The company owns and operates two integrated resorts, including Crown Melbourne and Crown Perth. Its Crown Melbourne resort comprises 2,628 gaming machines and 540 gaming tables; the Crown Towers Melbourne hotel with 481 guest rooms, the Crown Metropol Melbourne hotel with 658 guest rooms, and the Crown Promenade Melbourne hotel with 465 guest rooms; a conference center; banqueting facilities; restaurants and bars; and designer brands and retail outlets. The company's Crown Perth resort includes the Crown Towers Perth hotel with 500 guest rooms; the Crown Metropol Perth hotel comprising 397 guest rooms; the Crown Promenade Perth hotel with 291 guest rooms; 2,500 gaming machines and 350 gaming tables; a 1,500-seat Crown Ballroom and 2,300-seat Crown Theatre; convention facilities; and restaurants and bars, and a resort. It also owns and operates the Crown Aspinalls, a casino in London; and engages in wagering and online social gaming activities. The company was formerly known as Crown Limited and changed its name to Crown Resorts Limited in October 2013. Crown Resorts Limited was incorporated in 2007 and is based in Southbank, Australia.
| Metric | 2021 | 2020 | 2019 | 2018 | 2017 | 2016 | 2015 | 2014 | 2013 | 2012 | 2011 | 2010 | 2009 | 2008 | 2007 |
|---|---|---|---|---|---|---|---|---|---|---|---|---|---|---|---|
| Revenue | 1.52B | 2.20B | 2.87B | 3.43B | 3.25B | 3.56B | 3.43B | 3.08B | 2.85B | 2.77B | 2.38B | 2.31B | 2.18B | 2.01B | 1.91B |
| Cost of Revenue | 112.70M | 124.10M | 157.60M | 159.10M | 153.61M | 142.04M | 141.35M | 2.39B | 2.30B | 2.17B | 1.92B | 1.78B | 1.66B | 1.53B | 95.48M |
| Gross Profit | 1.41B | 2.08B | 2.71B | 3.27B | 3.10B | 3.41B | 3.29B | 692.04M | 554.13M | 601.21M | 462.41M | 534.25M | 520.29M | 482.82M | 1.81B |
| Gross Profit Ratio | 92.60% | 94.36% | 94.50% | 95.35% | 95.28% | 96.01% | 95.88% | 22.49% | 19.42% | 21.68% | 19.44% | 23.11% | 23.92% | 24.04% | 95.00% |
| Research & Development | 0.00 | 0.00 | 0.00 | 0.00 | 0.00 | 0.00 | 0.00 | 0.00 | 0.00 | 0.00 | 0.00 | 0.00 | 0.00 | 0.00 | 0.00 |
| General & Administrative | 748.60M | 0.00 | 0.00 | 998.90M | 0.00 | 0.00 | 898.82M | 0.00 | 0.00 | 736.17M | 677.74M | 619.33M | 607.57M | 0.00 | 0.00 |
| Selling & Marketing | 0.00 | 0.00 | 0.00 | 0.00 | 0.00 | 0.00 | 0.00 | 0.00 | 0.00 | 0.00 | 0.00 | 0.00 | 0.00 | 0.00 | 0.00 |
| SG&A | 748.60M | 0.00 | 0.00 | 998.90M | 0.00 | 0.00 | 898.82M | 33.73M | 0.00 | 736.17M | 677.74M | 619.33M | 607.57M | 0.00 | 0.00 |
| Other Expenses | 1.06B | 2.15B | 2.44B | 2.09B | 2.94B | 3.16B | 2.17B | 304.10M | 306.84M | -475.16M | -439.61M | -422.29M | -341.06M | 188.31M | 1.45B |
| Operating Expenses | 1.81B | 2.15B | 2.44B | 3.09B | 2.94B | 3.16B | 3.07B | 337.83M | 306.84M | 261.01M | 238.13M | 197.04M | 266.51M | 188.31M | 1.45B |
| Cost & Expenses | 1.92B | 2.27B | 2.60B | 3.24B | 3.09B | 3.31B | 3.21B | 2.72B | 2.61B | 2.43B | 2.15B | 1.97B | 1.92B | 1.71B | 1.55B |
| Interest Income | 1.00M | 10.20M | 26.50M | 30.10M | 9.65M | 16.33M | 19.75M | 17.21M | 13.04M | 11.52M | 8.97M | 11.10M | 104.71M | 188.49M | 108.06M |
| Interest Expense | 66.20M | 7.80M | 36.60M | 76.10M | 143.62M | 215.67M | 132.09M | 116.25M | 133.45M | 113.58M | 75.55M | 84.13M | 187.41M | 132.99M | 151.20M |
| Depreciation & Amortization | 290.30M | 275.50M | 273.60M | 285.90M | 296.76M | 282.78M | 262.88M | 244.93M | 238.13M | 218.26M | 195.60M | 163.12M | 147.98M | 132.81M | 122.64M |
| EBITDA | 47.60M | 434.10M | 888.40M | 1.09B | 2.41B | 1.55B | 865.30M | 1.11B | 813.49M | 951.66M | 678.26M | 634.55M | -790.38M | 3.95B | 2.25B |
| EBITDA Ratio | 3.13% | 19.72% | 30.99% | 31.88% | 74.19% | 43.65% | 25.20% | 36.18% | 28.51% | 34.32% | 28.51% | 27.44% | -36.33% | 196.51% | 117.89% |
| Operating Income | -397.30M | -69.20M | 266.20M | 180.50M | 162.71M | 250.97M | 221.23M | 354.21M | 247.29M | 340.19M | 224.28M | 337.21M | 253.78M | 294.51M | 358.44M |
| Operating Income Ratio | -26.10% | -3.14% | 9.29% | 5.27% | 5.00% | 7.06% | 6.44% | 11.51% | 8.67% | 12.27% | 9.43% | 14.58% | 11.67% | 14.66% | 18.78% |
| Total Other Income/Expenses | 88.70M | 222.40M | 313.10M | 563.70M | 1.77B | 797.96M | 242.36M | 397.79M | 194.62M | 279.63M | 182.83M | 50.10M | -1.38B | -39.90M | 28.72M |
| Income Before Tax | -308.60M | 153.20M | 579.30M | 744.20M | 1.93B | 1.05B | 463.59M | 752.00M | 441.91M | 619.82M | 407.11M | 387.31M | -1.13B | 254.61M | 387.17M |
| Income Before Tax Ratio | -20.27% | 6.96% | 20.21% | 21.73% | 59.39% | 29.49% | 13.50% | 24.44% | 15.49% | 22.35% | 17.11% | 16.75% | -51.75% | 12.68% | 20.29% |
| Income Tax Expense | -47.30M | 71.30M | 176.40M | 171.00M | 106.82M | 105.35M | 85.28M | 96.24M | 46.13M | 106.49M | 71.26M | 95.02M | 72.13M | 117.61M | 18.77M |
| Net Income | -261.60M | 79.50M | 401.80M | 558.90M | 1.87B | 948.82M | 385.05M | 655.76M | 395.79M | 513.33M | 335.86M | 292.29M | -1.20B | 3.56B | 1.96B |
| Net Income Ratio | -17.18% | 3.61% | 14.02% | 16.32% | 57.36% | 26.68% | 11.21% | 21.31% | 13.87% | 18.51% | 14.12% | 12.64% | -55.07% | 177.42% | 102.55% |
| EPS | -0.77 | 0.23 | 1.18 | 1.63 | 5.42 | 2.61 | 1.06 | 1.80 | 1.09 | 1.40 | 0.89 | 0.77 | -3.34 | 10.34 | 5.72 |
| EPS Diluted | -0.77 | 0.23 | 1.18 | 1.63 | 5.42 | 2.61 | 1.06 | 1.80 | 1.09 | 1.40 | 0.89 | 0.77 | -3.34 | 10.34 | 5.72 |
| Weighted Avg Shares Out | 338.58M | 338.58M | 340.51M | 343.71M | 344.42M | 364.20M | 364.20M | 364.20M | 364.18M | 367.82M | 377.07M | 379.21M | 358.89M | 344.61M | 342.33M |
| Weighted Avg Shares Out (Dil) | 338.58M | 338.58M | 340.51M | 343.71M | 344.42M | 364.20M | 364.20M | 364.20M | 364.18M | 367.82M | 377.07M | 379.21M | 358.89M | 344.61M | 342.33M |
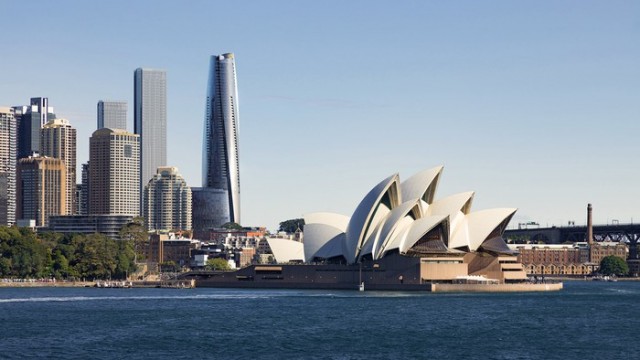
Crown Resorts fined A$1 million by Australia regulator for flouting junket rules
Australia's Crown targets 2022 opening for troubled Sydney casino
Australia's Crown says Blackstone's $6.2 billion buyout offer not 'compelling'
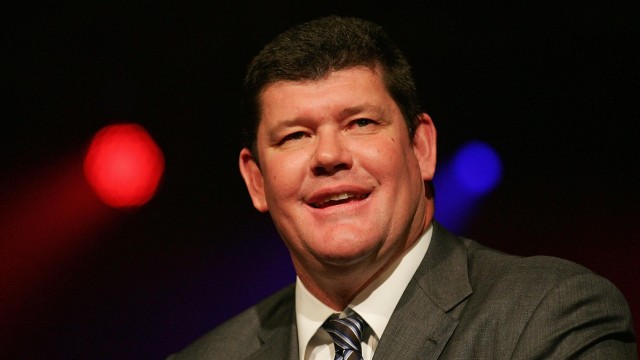
Blackstone Revives Takeover Bid For Billionaire James Packer's Crown Resorts In Deal Valued At $6.2 Billion
Australia's Crown Resorts gets $6.2 billion offer from Blackstone
Australia's Crown Resorts settles lawsuit on 2016 China marketing for $94 million
Billionaire James Packer's Crown Keeps Melbourne Casino License As Regulator Oversees Reforms
Australia's Crown branded 'disgraceful', gets two years to fix Melbourne casino
Crown Resorts shareholders reject executive pay plans, but spare board
Australia's Crown Resorts warns may not continue as 'going concern'
Source: https://incomestatements.info
Category: Stock Reports
