See more : Nevada Exploration Inc. (NVDEF) Income Statement Analysis – Financial Results
Complete financial analysis of China XD Plastics Company Limited (CXDC) income statement, including revenue, profit margins, EPS and key performance metrics. Get detailed insights into the financial performance of China XD Plastics Company Limited, a leading company in the Chemicals – Specialty industry within the Basic Materials sector.
- Chausseria (CHSR.PA) Income Statement Analysis – Financial Results
- China Hanking Holdings Limited (3788.HK) Income Statement Analysis – Financial Results
- Jungfraubahn Holding AG (0QNG.L) Income Statement Analysis – Financial Results
- BTS Group Holdings Public Company Limited (BTGRF) Income Statement Analysis – Financial Results
- The Greenbrier Companies, Inc. (GBX) Income Statement Analysis – Financial Results
China XD Plastics Company Limited (CXDC)
About China XD Plastics Company Limited
China XD Plastics Company Limited, together with its subsidiaries, engages in the research, development, manufacture, and sale of modified plastics primarily for automotive applications in the People's Republic of China, and Dubai, the United Arab Emirates. Its modified plastics are used to fabricate various auto components, including exteriors consisting of automobile bumpers, rearview and sideview mirrors, and license plate parts; interiors, such as door panels, steering wheels, dashboards, glove compartments, and safety belt components; and functional components comprising air conditioner casings, heating and ventilation casings, engine covers, and air ducts. The company also offers engineered plastics and environment-friendly plastics for use in oilfield equipment, mining equipment, vessel propulsion systems, and power station equipment; and polymer composite materials. Its products are also used in high-speed railways, airplanes, ships, and electronic appliances. The company sells its products through distributors, as well as directly to end customers. China XD Plastics Company Limited was founded in 1985 and is headquartered in Harbin, the People's Republic of China.
| Metric | 2020 | 2019 | 2018 | 2017 | 2016 | 2015 | 2014 | 2013 | 2012 | 2011 | 2010 | 2009 | 2008 | 2007 | 2006 | 2005 | 2004 |
|---|---|---|---|---|---|---|---|---|---|---|---|---|---|---|---|---|---|
| Revenue | 1.31B | 1.45B | 1.27B | 1.29B | 1.20B | 999.19M | 1.11B | 1.05B | 599.82M | 381.62M | 249.82M | 135.75M | 75.77M | 71.29K | 63.11K | 96.75K | 96.05K |
| Cost of Revenue | 1.17B | 1.23B | 1.06B | 1.05B | 954.72M | 817.81M | 888.23M | 827.42M | 456.01M | 285.80M | 188.29M | 105.16M | 58.43M | 63.57K | 96.06K | 106.73K | 164.67K |
| Gross Profit | 143.72M | 219.40M | 219.61M | 236.67M | 246.96M | 181.38M | 222.46M | 223.40M | 143.81M | 95.82M | 61.53M | 30.58M | 17.33M | 7.72K | -32.95K | -9.98K | -68.62K |
| Gross Profit Ratio | 10.96% | 15.15% | 17.23% | 18.34% | 20.55% | 18.15% | 20.03% | 21.26% | 23.98% | 25.11% | 24.63% | 22.53% | 22.88% | 10.83% | -52.21% | -10.31% | -71.44% |
| Research & Development | -22.49M | 50.33M | 60.58M | 36.84M | 47.99M | 21.06M | 29.43M | 21.26M | 21.59M | 11.64M | 7.38M | 1.33M | 778.99K | 0.00 | 0.00 | 0.00 | 0.00 |
| General & Administrative | -32.46M | 35.37M | 36.99M | 38.50M | 29.95M | 23.82M | 20.56M | 16.28M | 10.07M | 7.07M | 19.96M | 11.22M | 1.75M | 97.88K | 147.19K | 71.28K | 7.85K |
| Selling & Marketing | -1.22M | 1.47M | 10.07M | 3.18M | 1.36M | 1.46M | 728.23K | 243.98K | 273.29K | 254.77K | 470.73K | 400.73K | 322.65K | 0.00 | 0.00 | 0.00 | 0.00 |
| SG&A | -33.68M | 36.84M | 47.05M | 41.67M | 31.31M | 25.27M | 21.29M | 16.53M | 10.34M | 7.32M | 20.43M | 11.62M | 2.07M | 97.88K | 147.19K | 71.28K | 7.85K |
| Other Expenses | 0.00 | 52.68M | -6.12M | -11.62M | -3.91M | -2.99M | -2.72M | -924.22K | -114.39K | 0.00 | 27.81M | 12.95M | 2.85M | 0.00 | 0.00 | 0.00 | 0.00 |
| Operating Expenses | -56.17M | 139.84M | 101.51M | 66.89M | 75.38M | 43.34M | 48.00M | 36.86M | 31.81M | 18.96M | 27.81M | 12.95M | 2.85M | 97.88K | 147.19K | 71.28K | 7.85K |
| Cost & Expenses | 1.11B | 1.37B | 1.16B | 1.12B | 1.03B | 861.16M | 936.23M | 864.28M | 487.83M | 304.76M | 216.11M | 118.11M | 61.28M | 161.45K | 243.26K | 178.01K | 172.52K |
| Interest Income | 1,673.50B | 1.38M | 3.98M | 5.29M | 5.85M | 8.22M | 10.98M | 6.79M | 4.60M | 689.92K | 0.00 | 0.00 | 0.00 | 0.00 | 0.00 | 0.00 | 0.00 |
| Interest Expense | -71.18M | 67.24M | 51.03M | 45.37M | 41.37M | 42.70M | 41.52M | 15.25M | 4.63M | 1.81M | 1.29M | 1.42M | 687.66K | 23.19K | 2.98K | 108.00 | 927.00 |
| Depreciation & Amortization | 62.54M | 60.66M | 46.28M | 43.06M | 34.24M | 27.54M | 22.92M | 21.42M | 10.71M | 5.14M | 3.33M | 2.01M | 967.11K | 9.34K | 33.01K | 30.46K | 42.47K |
| EBITDA | -196.10M | 145.00M | 173.34M | 210.57M | 194.65M | 172.21M | 203.48M | 217.21M | 130.72M | 85.58M | 54.76M | 7.52M | 15.38M | -77.06K | -147.13K | -58.93K | -34.26K |
| EBITDA Ratio | -14.95% | 10.01% | 13.60% | 16.32% | 16.20% | 17.24% | 18.32% | 20.67% | 21.79% | 22.43% | 21.92% | 5.54% | 20.30% | -108.09% | -233.11% | -60.91% | -35.67% |
| Operating Income | -102.04M | 69.42M | 111.98M | 158.15M | 167.66M | 135.05M | 171.73M | 185.61M | 111.88M | 76.86M | 33.72M | 17.63M | 14.48M | -90.16K | -180.14K | -81.26K | -76.47K |
| Operating Income Ratio | -7.78% | 4.79% | 8.78% | 12.26% | 13.95% | 13.52% | 15.46% | 17.66% | 18.65% | 20.14% | 13.50% | 12.99% | 19.12% | -126.47% | -285.42% | -83.99% | -79.61% |
| Total Other Income/Expenses | -73.90M | 17,092.11B | 76,026.42B | 122,145.95B | 119,035.40B | 101,970.12B | -32.69M | -5.07M | 3.51M | 1.77M | -4.88M | -13.54M | -761.52K | -19.42K | 0.00 | -8.13K | -263.00 |
| Income Before Tax | -175.94M | 17.09M | 76.03M | 122.15M | 119.04M | 101.97M | 139.04M | 180.54M | 115.38M | 78.63M | 50.14M | 4.09M | 13.72M | -109.59K | 0.00 | -89.39K | -76.73K |
| Income Before Tax Ratio | -13.41% | 1.18% | 5.96% | 9.47% | 9.91% | 10.21% | 12.52% | 17.18% | 19.24% | 20.60% | 20.07% | 3.01% | 18.11% | -153.72% | 0.00% | -92.39% | -79.89% |
| Income Tax Expense | -5.76M | 14.04M | 7.71M | 90.52M | 17.42M | 18.24M | 18.27M | 46.70M | 29.52M | 18.11M | 21.31M | 67.25K | 35.33K | 735.00 | 2.98K | -8.02K | 664.00 |
| Net Income | -181.70M | 3.06M | 68.31M | 31.62M | 101.61M | 83.73M | 120.78M | 133.84M | 85.87M | 60.52M | 28.84M | 4.02M | 13.69M | -110.32K | -183.12K | -89.50K | -77.66K |
| Net Income Ratio | -13.85% | 0.21% | 5.36% | 2.45% | 8.46% | 8.38% | 10.87% | 12.74% | 14.32% | 15.86% | 11.54% | 2.96% | 18.07% | -154.75% | -290.15% | -92.51% | -80.85% |
| EPS | -2.68 | 0.05 | 1.36 | 0.64 | 2.06 | 1.70 | 2.47 | 2.80 | 1.81 | 1.28 | 0.65 | 0.14 | 33.02 | -0.28 | -0.46 | -0.22 | -0.19 |
| EPS Diluted | -2.68 | 0.05 | 1.36 | 0.64 | 2.06 | 1.70 | 2.47 | 2.80 | 1.81 | 1.28 | 0.64 | 0.14 | 0.35 | -0.28 | -0.46 | -0.22 | -0.19 |
| Weighted Avg Shares Out | 67.92M | 61.11M | 50.29M | 49.60M | 49.42M | 49.23M | 48.83M | 47.79M | 47.55M | 47.28M | 44.25M | 27.79M | 414.57K | 399.94K | 399.94K | 399.94K | 399.94K |
| Weighted Avg Shares Out (Dil) | 67.92M | 61.11M | 50.29M | 49.60M | 49.42M | 49.23M | 48.83M | 47.79M | 47.55M | 47.29M | 44.73M | 27.79M | 38.61M | 399.94K | 399.94K | 399.94K | 399.94K |

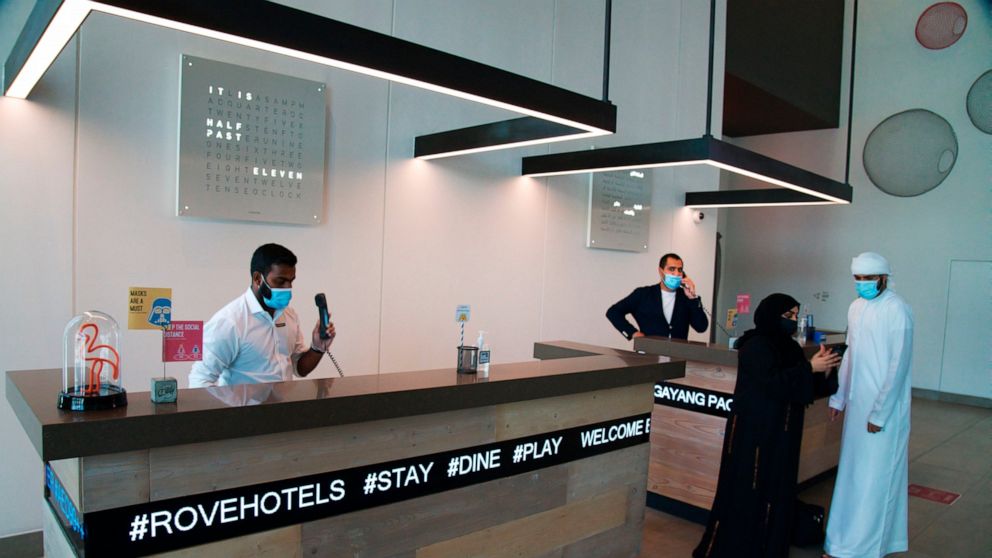
Thermometers in hand, Dubai opens for tourists amid pandemic

Dubai hotels ready to welcome foreign visitors as emirate reopens

UAE orders government shakeup as virus erodes economic gains

Dan Biggar rules out France move and announces he's staying in England

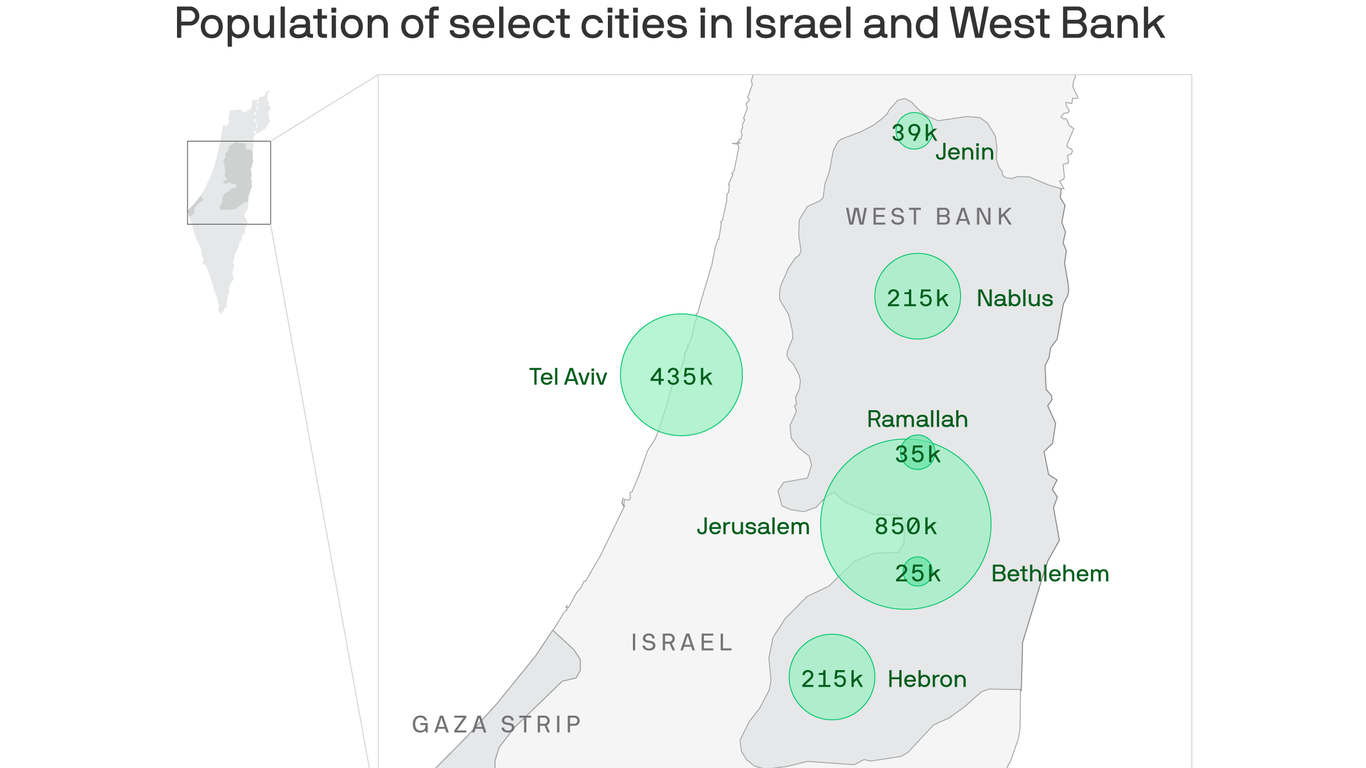
Why Israel’s annexation plans matter for the region

Coronavirus: UAE records 421 new COVID-19 cases, one new death, 490 recoveries

Perak striker eyes place in World Cup qualifying team

Coronavirus: UAE announces gradual reopening of mosques, places of worship July 1

FACTBOX-Deals by major suppliers in the race for 5G
Source: https://incomestatements.info
Category: Stock Reports

