See more : EonX Technologies Inc. (EONX.CN) Income Statement Analysis – Financial Results
Complete financial analysis of Carl Zeiss Meditec AG (CZMWY) income statement, including revenue, profit margins, EPS and key performance metrics. Get detailed insights into the financial performance of Carl Zeiss Meditec AG, a leading company in the Medical – Instruments & Supplies industry within the Healthcare sector.
- Solarvest BioEnergy Inc. (SVS.V) Income Statement Analysis – Financial Results
- Makalot Industrial Co., Ltd. (1477.TW) Income Statement Analysis – Financial Results
- Companhia Estadual de Geração e Transmissão de Energia Elétrica – CEEE-GT (EEEL3.SA) Income Statement Analysis – Financial Results
- Global Business Travel Group, Inc. (GBTG) Income Statement Analysis – Financial Results
- China Carbon Neutral Development Group Limited (1372.HK) Income Statement Analysis – Financial Results
Carl Zeiss Meditec AG (CZMWY)
Industry: Medical - Instruments & Supplies
Sector: Healthcare
About Carl Zeiss Meditec AG
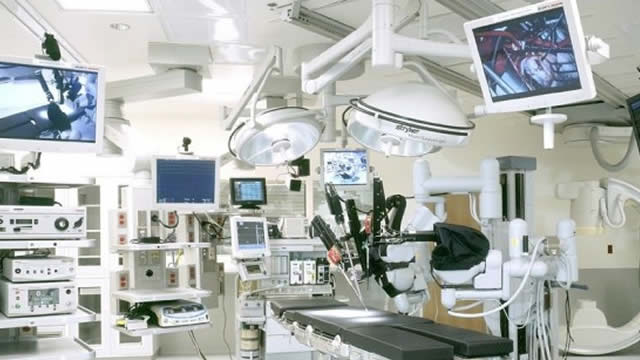
Carl Zeiss Meditec AG operates as a medical technology company in Germany, rest of Europe, the United States, Asia, and internationally. It operates in two segments, Ophthalmic Devices and Microsurgery. The Ophthalmic Devices segment offers products and solutions for the diagnosis and treatment of eye diseases; and systems and consumables for cataract, retinal, and refractive surgeries. It serves practicing ophthalmologists and optometrists, as well as physicians and surgeons in hospitals and outpatient surgery centers. The Microsurgery segment offers visualization solutions for invasive surgical treatments; and solutions in the area of ear, nose and throat, plastic and reconstructive, dental and spinal surgeries. It serves physicians in various fields and hospitals. The company was founded in 1846 and is headquartered in Jena, Germany. Carl Zeiss Meditec AG is a subsidiary of Carl Zeiss AG.
| Metric | 2024 | 2023 | 2022 | 2021 | 2020 | 2019 | 2018 | 2017 | 2016 | 2015 | 2014 | 2013 | 2012 | 2011 | 2010 | 2009 | 2008 | 2007 | 2006 | 2005 |
|---|---|---|---|---|---|---|---|---|---|---|---|---|---|---|---|---|---|---|---|---|
| Revenue | 2.07B | 2.09B | 1.90B | 1.65B | 1.34B | 1.46B | 1.28B | 1.19B | 1.09B | 1.04B | 909.26M | 906.45M | 861.88M | 758.79M | 676.68M | 640.09M | 600.19M | 569.70M | 390.56M | 0.00 |
| Cost of Revenue | 977.50M | 883.54M | 775.24M | 679.57M | 589.94M | 627.44M | 570.47M | 533.16M | 508.82M | 500.38M | 420.88M | 418.62M | 400.51M | 343.96M | 317.96M | 317.80M | 296.75M | 274.18M | -206.80M | -171.42M |
| Gross Profit | 1.09B | 1.21B | 1.13B | 967.21M | 745.52M | 831.88M | 710.39M | 656.73M | 579.55M | 539.68M | 488.37M | 487.82M | 461.36M | 414.84M | 358.73M | 322.29M | 303.44M | 295.52M | 597.37M | 171.42M |
| Gross Profit Ratio | 52.69% | 57.71% | 59.26% | 58.73% | 55.83% | 57.00% | 55.46% | 55.19% | 53.25% | 51.89% | 53.71% | 53.82% | 53.53% | 54.67% | 53.01% | 50.35% | 50.56% | 51.87% | 152.95% | 0.00% |
| Research & Development | 343.09M | 375.81M | 291.37M | 232.07M | 218.80M | 173.31M | 159.63M | 145.79M | 123.41M | 111.96M | 99.75M | 97.32M | 93.45M | 84.22M | 72.36M | 63.46M | 61.96M | 59.24M | -38.30M | -31.76M |
| General & Administrative | 111.01M | 83.78M | 77.88M | 60.75M | 56.32M | 57.68M | 49.83M | 48.09M | 46.48M | 49.19M | 41.79M | 42.32M | 40.98M | 40.28M | 37.25M | 32.37M | 32.27M | 32.13M | 23.61M | 0.00 |
| Selling & Marketing | 458.20M | 420.28M | 360.18M | 303.23M | 292.84M | 336.23M | 303.82M | 289.56M | 255.33M | 247.95M | 226.13M | 214.29M | 204.04M | 187.14M | 162.80M | 150.65M | 141.79M | 134.40M | -74.88M | -67.86M |
| SG&A | 569.21M | 504.06M | 438.06M | 363.98M | 349.16M | 393.91M | 353.65M | 337.65M | 301.81M | 297.14M | 267.92M | 256.61M | 245.01M | 227.42M | 200.05M | 183.02M | 174.06M | 166.53M | -74.88M | -67.86M |
| Other Expenses | 176.33M | 0.00 | 1.29M | -2.45M | 0.00 | 0.00 | -15.00K | 993.00K | 0.00 | 0.00 | 0.00 | 17.00K | 2.69M | -2.57M | -418.00K | -16.63M | 12.70M | -495.00K | 0.00 | 0.00 |
| Operating Expenses | 1.09B | 878.63M | 730.72M | 593.60M | 567.97M | 567.23M | 513.26M | 484.43M | 425.21M | 409.09M | 367.67M | 353.95M | 338.46M | 311.27M | 271.98M | 229.84M | 248.72M | 225.27M | -113.19M | -99.62M |
| Cost & Expenses | 2.07B | 1.76B | 1.51B | 1.27B | 1.16B | 1.19B | 1.08B | 1.02B | 934.03M | 909.47M | 788.55M | 772.57M | 738.98M | 655.23M | 589.94M | 547.64M | 545.47M | 499.45M | -319.99M | -271.04M |
| Interest Income | 23.27M | 29.05M | 13.25M | 1.56M | 1.46M | 1.80M | 977.00K | 937.00K | 1.08M | 1.30M | 1.93M | 5.18M | 3.02M | 4.52M | 5.86M | 5.28M | 9.77M | 9.71M | 2.47M | 0.00 |
| Interest Expense | 29.42M | 1.92M | 9.59M | 9.37M | 27.89M | 8.21M | 2.66M | 2.70M | 3.60M | 2.78M | 2.95M | 6.59M | 6.08M | 7.17M | 5.88M | 6.00M | 5.71M | 6.39M | 3.37M | 0.00 |
| Depreciation & Amortization | 132.77M | 74.06M | 69.77M | 61.58M | 60.43M | 48.37M | 31.28M | 24.24M | 20.23M | 19.16M | 17.95M | 18.72M | 17.90M | 18.94M | 20.97M | 16.37M | 12.73M | 11.82M | 10.77M | 9.12M |
| EBITDA | 403.06M | 501.88M | 482.85M | 410.00M | 267.03M | 286.44M | 213.12M | 206.96M | 165.78M | 135.15M | 135.44M | 168.40M | 140.16M | 126.99M | 109.79M | 100.98M | 94.17M | 94.33M | 59.70M | 280.16M |
| EBITDA Ratio | 19.51% | 24.02% | 25.38% | 24.90% | 20.00% | 19.63% | 16.44% | 17.39% | 15.31% | 12.99% | 14.90% | 19.07% | 16.26% | 16.74% | 16.23% | 15.78% | 15.69% | 16.56% | 84.69% | 0.00% |
| Operating Income | 0.00 | 327.14M | 413.08M | 348.42M | 206.61M | 238.07M | 179.34M | 182.72M | 146.37M | 115.99M | 117.48M | 154.18M | 122.90M | 103.57M | 86.74M | 76.08M | 67.83M | 70.36M | 48.09M | 35.73M |
| Operating Income Ratio | 0.00% | 15.66% | 21.71% | 21.16% | 15.47% | 16.31% | 14.00% | 15.36% | 13.45% | 11.15% | 12.92% | 17.01% | 14.26% | 13.65% | 12.82% | 11.89% | 11.30% | 12.35% | 12.31% | 0.00% |
| Total Other Income/Expenses | 240.87M | 85.43M | 31.47M | -11.86M | 19.37M | -8.21M | -157.00K | 5.83M | -4.41M | -14.27M | -2.95M | -6.59M | -6.72M | -2.69M | -3.73M | 2.53M | 7.52M | 5.75M | -2.52M | 0.00 |
| Income Before Tax | 240.87M | 412.56M | 403.49M | 339.05M | 178.72M | 229.86M | 179.18M | 188.56M | 141.96M | 101.72M | 114.54M | 147.59M | 116.18M | 100.88M | 82.98M | 78.62M | 75.73M | 76.11M | 45.56M | 0.00 |
| Income Before Tax Ratio | 11.66% | 19.75% | 21.20% | 20.59% | 13.38% | 15.75% | 13.99% | 15.85% | 13.04% | 9.78% | 12.60% | 16.28% | 13.48% | 13.29% | 12.26% | 12.28% | 12.62% | 13.36% | 11.67% | 0.00% |
| Income Tax Expense | 60.71M | 120.56M | 107.58M | 101.53M | 55.30M | 69.28M | 52.95M | 52.78M | 41.99M | 36.16M | 35.38M | 48.47M | 39.79M | 28.61M | 23.34M | 23.51M | 19.49M | 26.47M | 15.86M | 0.00 |
| Net Income | 178.73M | 290.40M | 293.91M | 236.28M | 122.39M | 159.76M | 126.46M | 134.45M | 98.33M | 62.30M | 74.95M | 92.13M | 71.87M | 66.91M | 54.85M | 50.54M | 54.05M | 47.76M | 26.69M | 0.00 |
| Net Income Ratio | 8.65% | 13.90% | 15.45% | 14.35% | 9.16% | 10.95% | 9.87% | 11.30% | 9.03% | 5.99% | 8.24% | 10.16% | 8.34% | 8.82% | 8.11% | 7.90% | 9.01% | 8.38% | 6.83% | 0.00% |
| EPS | 1.99 | 3.25 | 3.29 | 2.64 | 1.37 | 1.79 | 1.41 | 1.57 | 1.21 | 0.77 | 0.92 | 1.13 | 0.88 | 0.82 | 0.68 | 0.62 | 0.66 | 0.61 | 0.82 | 0.54 |
| EPS Diluted | 1.99 | 3.25 | 3.29 | 2.64 | 1.37 | 1.79 | 1.41 | 1.57 | 1.21 | 0.77 | 0.92 | 1.13 | 0.88 | 0.82 | 0.68 | 0.62 | 0.66 | 0.61 | 0.82 | 0.54 |
| Weighted Avg Shares Out | 89.74M | 89.44M | 89.44M | 89.44M | 89.44M | 89.44M | 89.44M | 85.59M | 81.31M | 81.31M | 81.31M | 81.31M | 81.31M | 81.31M | 81.31M | 81.31M | 81.31M | 77.97M | 32.52M | 32.52M |
| Weighted Avg Shares Out (Dil) | 89.74M | 89.44M | 89.44M | 89.44M | 89.44M | 89.44M | 89.44M | 85.59M | 81.31M | 81.31M | 81.31M | 81.31M | 81.31M | 81.31M | 81.31M | 81.31M | 81.31M | 77.97M | 32.52M | 32.52M |

Carl Zeiss: Why I Am So Positive

My 3 Favorite European Stocks To Diversify Your Portfolio

Carl Zeiss: Significant Underperformance, Valuation At Multi-Year Lows

Carl Zeiss Meditec AG (CZMWF) Q3 2024 Earnings Call Transcript

Carl Zeiss Meditec: Slightly Better Valuation, Still A Significant Upside

Carl Zeiss Meditec AG (CZMWF) Q2 2024 Earnings Call Transcript

Carl Zeiss: We've Seen Outperformance, But I See More Upside Potential

Carl Zeiss Meditec AG announces agreement to acquire Dutch Ophthalmic Research Center (D.O.R.C.)

Carl Zeiss Meditec: Premiums Are Proven To Be Dicey In This Market

Carl Zeiss Meditec: One Of The Highest Premiums I'll Accept
Source: https://incomestatements.info
Category: Stock Reports
