See more : BDO Unibank, Inc. (BDOUF) Income Statement Analysis – Financial Results
Complete financial analysis of BNY Mellon Municipal Bond Infrastructure Fund, Inc. (DMB) income statement, including revenue, profit margins, EPS and key performance metrics. Get detailed insights into the financial performance of BNY Mellon Municipal Bond Infrastructure Fund, Inc., a leading company in the Asset Management – Bonds industry within the Financial Services sector.
- Tianjin Tianbao Energy Co., Ltd. (1671.HK) Income Statement Analysis – Financial Results
- Maritime Launch Services Inc. (MAXQF) Income Statement Analysis – Financial Results
- SentinelOne, Inc. (S&SPOWER.NS) Income Statement Analysis – Financial Results
- Nanoforce, Inc. (NNFC) Income Statement Analysis – Financial Results
- Monopar Therapeutics Inc. (MNPR) Income Statement Analysis – Financial Results
BNY Mellon Municipal Bond Infrastructure Fund, Inc. (DMB)
Industry: Asset Management - Bonds
Sector: Financial Services
About BNY Mellon Municipal Bond Infrastructure Fund, Inc.
BNY Mellon Municipal Bond Infrastructure Fund, Inc. is a closed ended fixed income mutual fund launched and managed by BNY Mellon Investment Adviser, Inc. The fund invests in the fixed income markets of the United States. It primarily invests in the tax-exempt investment grade debt obligations issued by or on behalf of states, territories and possessions of the United States and the District of Columbia and their political subdivisions, agencies and instrumentalities, or multistate agencies or authorities, and certain other specified securities. The fund invests its bonds issued by infrastructure sector including transportation, energy and utilities, social infrastructure, water and environment, and other similar public sectors which are rated as BBB- and above by S&P and Fitch and Baa3 and above by Moody's with an effective duration of up to 14 years. It employs fundamental and quantitative analysis with a bottom-up security picking approach by focusing on factors such as the relative value and attractiveness of various sectors and securities to seek to exploit pricing inefficiencies in the municipal bond market, actively trading among various sectors based on their apparent values, general economic and monetary conditions, prevailing interest rates and the condition of the general money market and the municipal bond market, the size of a particular offering, the maturity of the obligation, and the rating of the issue to create its portfolio. The fund was formerly known as Dreyfus Municipal Bond Infrastructure Fund, Inc. BNY Mellon Municipal Bond Infrastructure Fund, Inc. was formed on April 25, 2013 and is domiciled in the United States.
| Metric | 2023 | 2022 | 2021 | 2020 | 2019 | 2018 | 2017 | 2016 | 2015 | 2014 | 2013 |
|---|---|---|---|---|---|---|---|---|---|---|---|
| Revenue | 15.14M | -28.79M | 2.12M | 274.37K | 36.08M | 8.23M | 17.24M | 18.15M | 18.26M | 17.46M | 16.72M |
| Cost of Revenue | -104.31K | 2.39M | 2.75M | 2.72M | 18.78M | -9.47M | 2.62M | 2.63M | 2.59M | 0.00 | 0.00 |
| Gross Profit | 15.24M | -31.18M | -632.20K | -2.45M | 17.30M | 17.70M | 14.62M | 15.52M | 15.67M | 17.46M | 16.72M |
| Gross Profit Ratio | 100.69% | 108.30% | -29.89% | -892.36% | 47.95% | 215.15% | 84.80% | 85.51% | 85.82% | 100.00% | 100.00% |
| Research & Development | 0.00 | 0.00 | 0.00 | 0.00 | 0.00 | 0.00 | 0.00 | 0.00 | 0.00 | 0.00 | 0.00 |
| General & Administrative | 2.50M | 347.79K | 414.20K | 498.05K | 291.86K | 424.67K | 472.47K | 2.88M | 2.77M | 2.65M | 2.54M |
| Selling & Marketing | 0.00 | 0.00 | 0.00 | 0.00 | 0.00 | 0.00 | 0.00 | 0.00 | 0.00 | 0.00 | 0.00 |
| SG&A | 2.50M | 347.79K | 414.20K | 498.05K | 291.86K | 424.67K | 472.47K | 2.88M | 2.77M | 2.65M | 2.54M |
| Other Expenses | 0.00 | -34.11M | -11.01M | -11.58M | 20.63K | 20.87K | 7.80K | 203.94K | 3.08M | 0.00 | 0.00 |
| Operating Expenses | 2.50M | 346.45K | 414.20K | 499.14K | 299.81K | 432.62K | 467.53K | 8.92M | -3.08M | 24.04M | 45.88M |
| Cost & Expenses | 2.50M | -41.41M | -12.90M | -15.47M | 21.25M | -7.10M | 467.53K | 11.67M | 956.06K | 24.04M | 45.88M |
| Interest Income | 15.24M | 15.54M | 16.08M | 17.02M | 17.30M | 17.70M | 17.87M | 0.00 | 0.00 | 0.00 | |
| Interest Expense | 5.06M | 3.27M | 1.48M | 1.78M | 2.77M | 2.72M | 2.32M | 4.24M | 1.44M | 1.15M | |
| Depreciation & Amortization | -12.74M | -12.94M | -13.07M | -13.96M | -14.46M | -14.93M | -15.08M | -14.47M | -14.51M | -14.80M | -14.19M |
| EBITDA | 0.00 | -25.87M | -9.89M | -29.10M | 0.00 | -7.14M | 1.69M | -8.00M | 2.79M | 0.00 | 0.00 |
| EBITDA Ratio | 0.00% | 157.51% | -607.79% | -5,819.85% | 51.41% | -120.81% | 110.73% | -44.06% | 15.30% | 144.63% | -266.12% |
| Operating Income | 12.74M | 12.94M | 13.07M | 13.96M | 14.46M | 14.93M | 19.09M | 8.43M | 18.74M | 14.80M | 14.19M |
| Operating Income Ratio | 84.20% | -44.96% | 618.06% | 5,089.59% | 40.09% | 181.48% | 110.73% | 46.46% | 102.66% | 84.80% | 84.84% |
| Total Other Income/Expenses | 2.01M | -42.08M | -11.37M | 2.50M | 21.32M | -7.14M | 1.69M | -8.00M | 0.00 | 25.25M | -44.50M |
| Income Before Tax | 14.76M | -29.14M | 1.70M | -224.77K | 35.78M | 7.79M | 16.77M | 6.47M | 17.30M | 40.05M | -30.31M |
| Income Before Tax Ratio | 97.50% | 101.20% | 80.42% | -81.92% | 99.17% | 94.74% | 97.29% | 35.68% | 94.76% | 229.43% | -181.28% |
| Income Tax Expense | 0.00 | -45.35M | -12.85M | -15.97M | 18.55M | -9.94M | 15.08M | -1.96M | -1.44M | 23.81M | -45.65M |
| Net Income | 14.76M | -29.14M | 1.70M | -224.77K | 35.78M | 7.79M | 16.77M | 6.47M | 17.30M | 40.05M | -30.31M |
| Net Income Ratio | 97.50% | 101.20% | 80.42% | -81.92% | 99.17% | 94.74% | 97.29% | 35.68% | 94.76% | 229.43% | -181.28% |
| EPS | 0.80 | -1.58 | 0.09 | -0.01 | 1.95 | 0.43 | 0.92 | 0.35 | 0.94 | 2.18 | 0.00 |
| EPS Diluted | 0.80 | -1.58 | 0.09 | -0.01 | 1.95 | 0.43 | 0.92 | 0.35 | 0.94 | 2.18 | 0.00 |
| Weighted Avg Shares Out | 18.41M | 18.41M | 18.40M | 18.39M | 18.39M | 18.12M | 18.23M | 18.38M | 18.38M | 18.38M | 0.00 |
| Weighted Avg Shares Out (Dil) | 18.41M | 18.41M | 18.40M | 18.39M | 18.39M | 18.12M | 18.23M | 18.38M | 18.38M | 18.38M | 0.00 |

BNY Mellon Alcentra Global Credit Income 2024 Target Term Fund, Inc. Declares Monthly Distribution

BNY Mellon High Yield Strategies Fund Declares Dividend

'FinCEN' documents reportedly show banks moved illicit funds - BuzzFeed, ICIJ
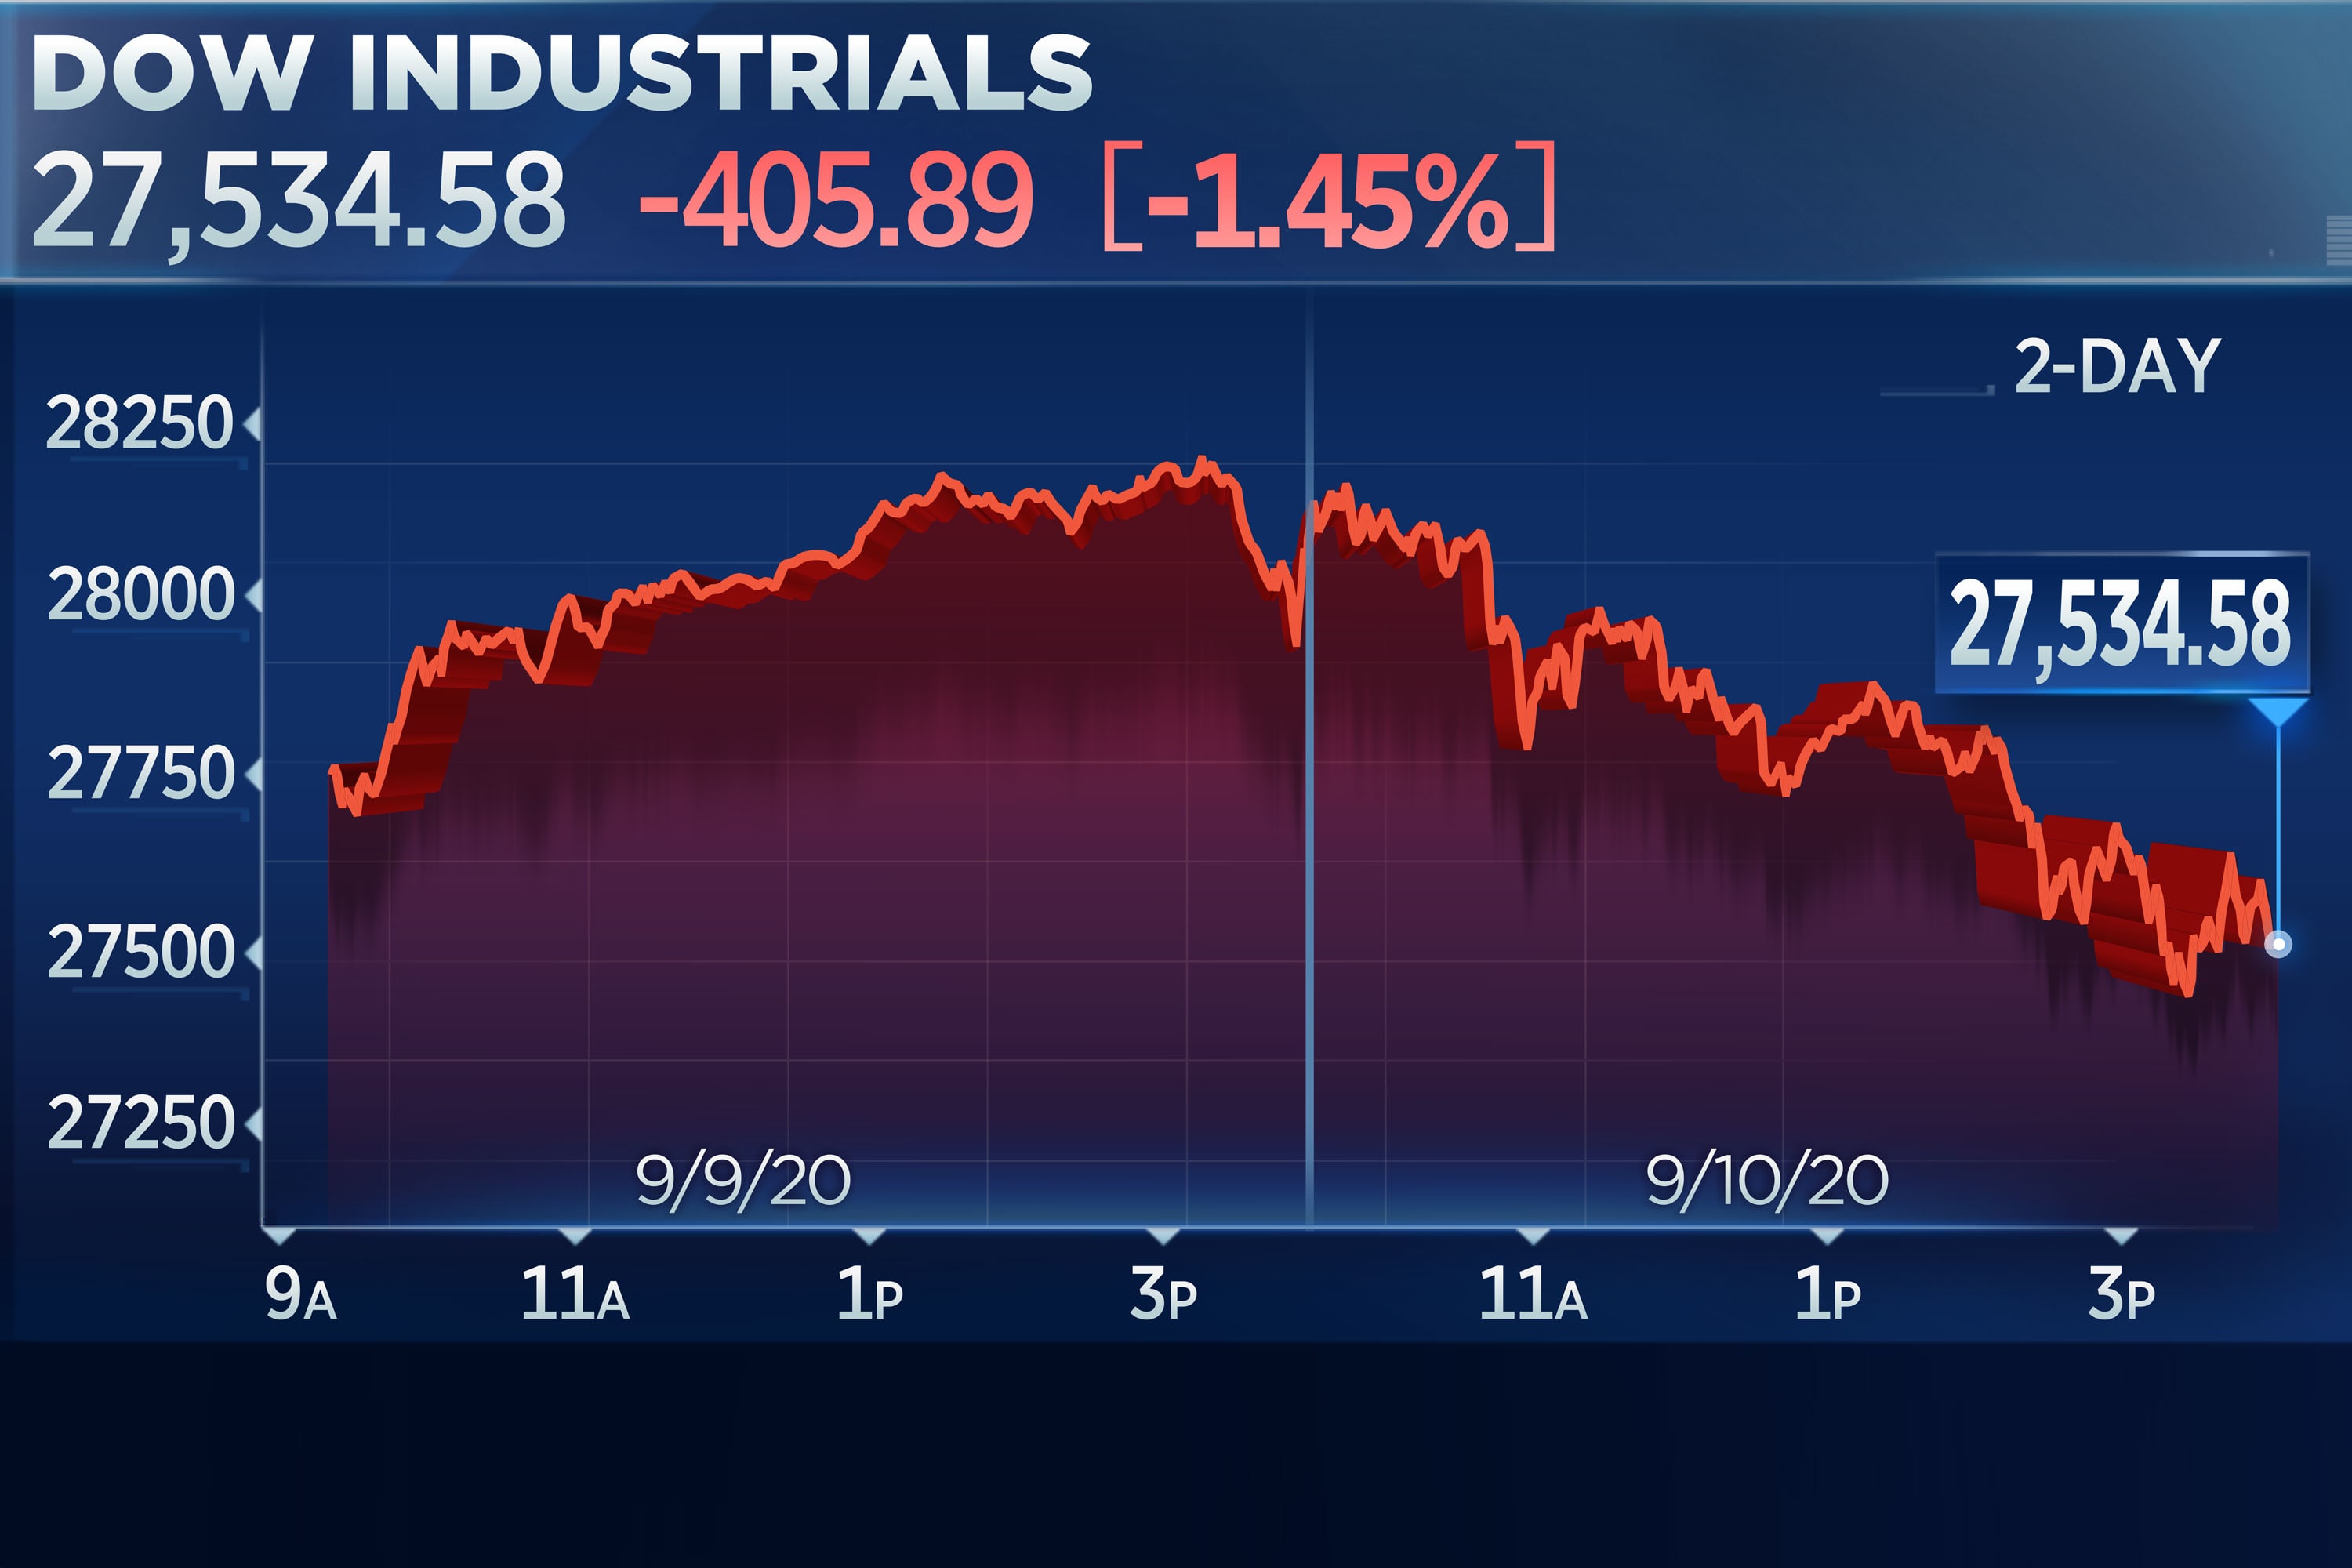
Dow closes 400 points lower as tech sell-off resumes
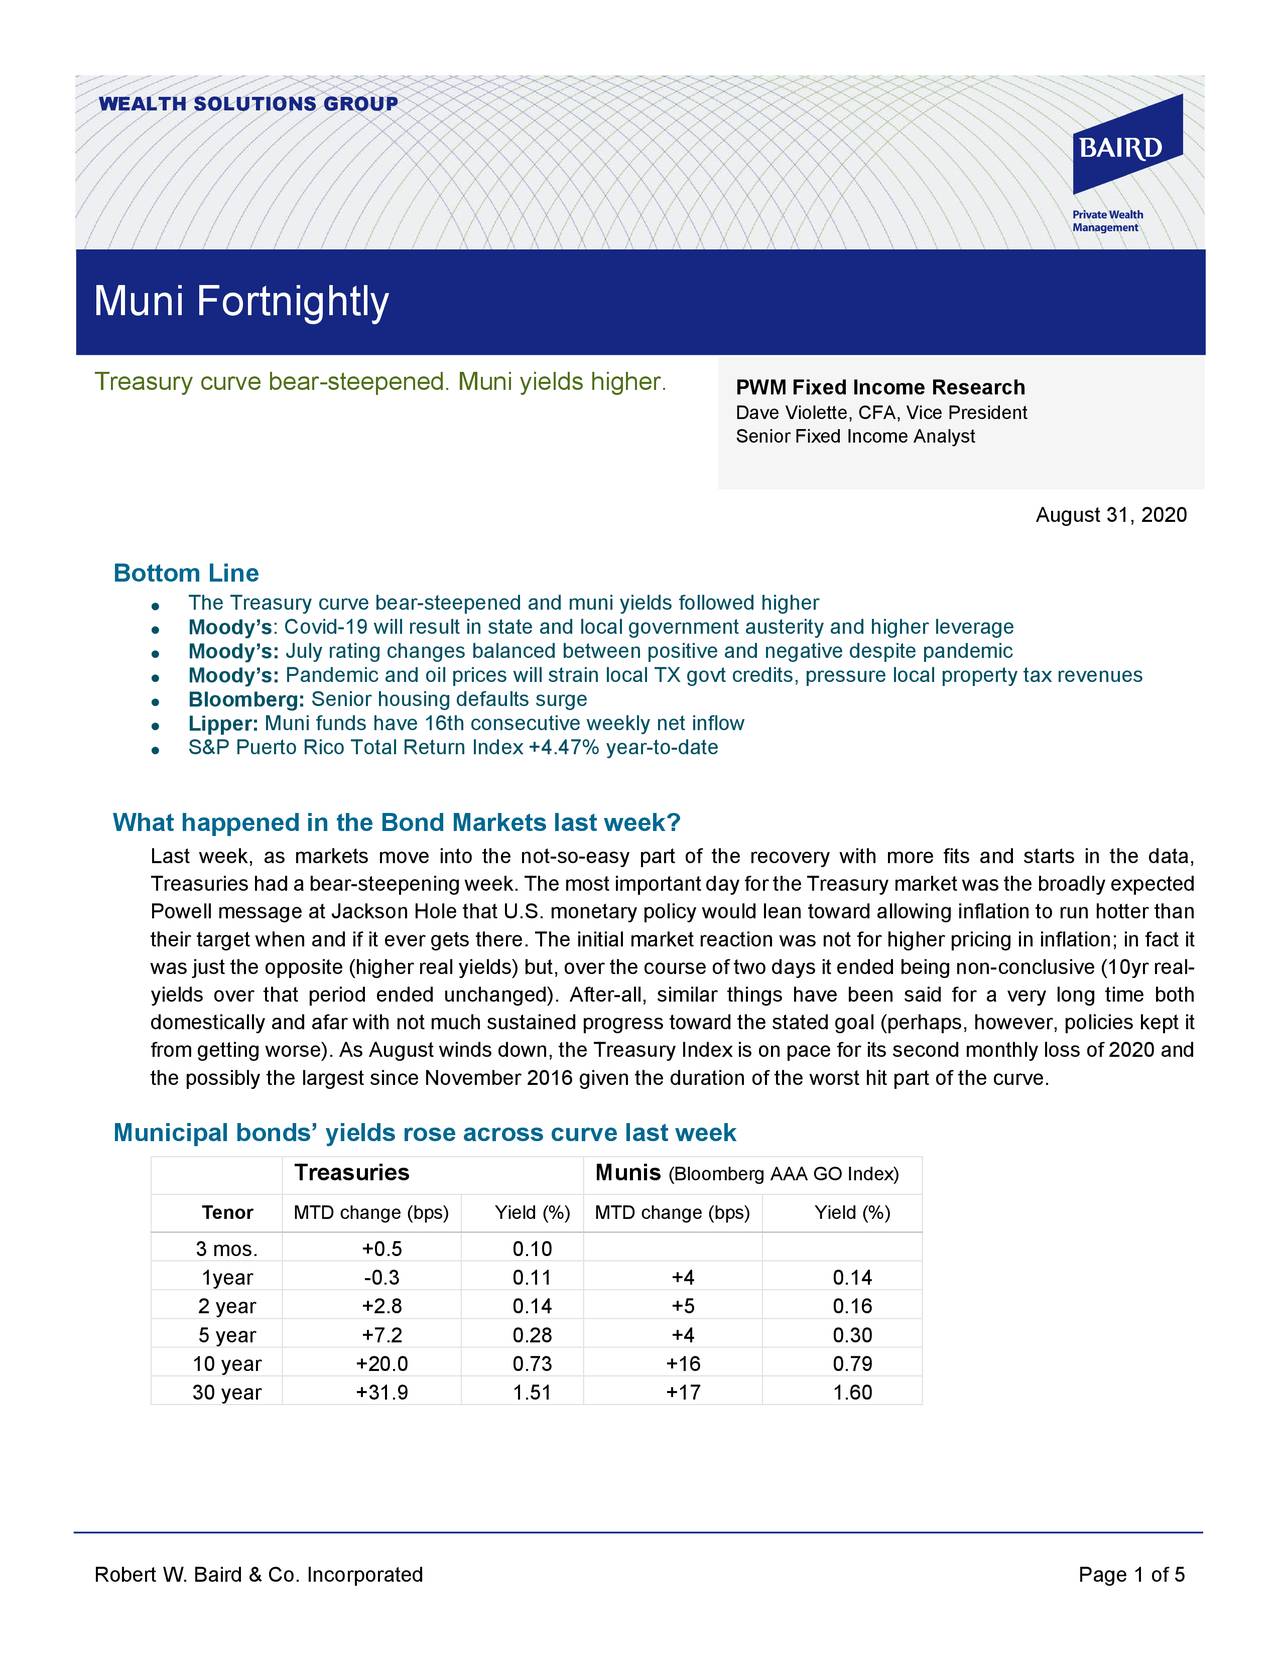
Treasury Curve Bear-Steepened; Muni Yields Higher - Muni Fortnightly, August 31, 2020
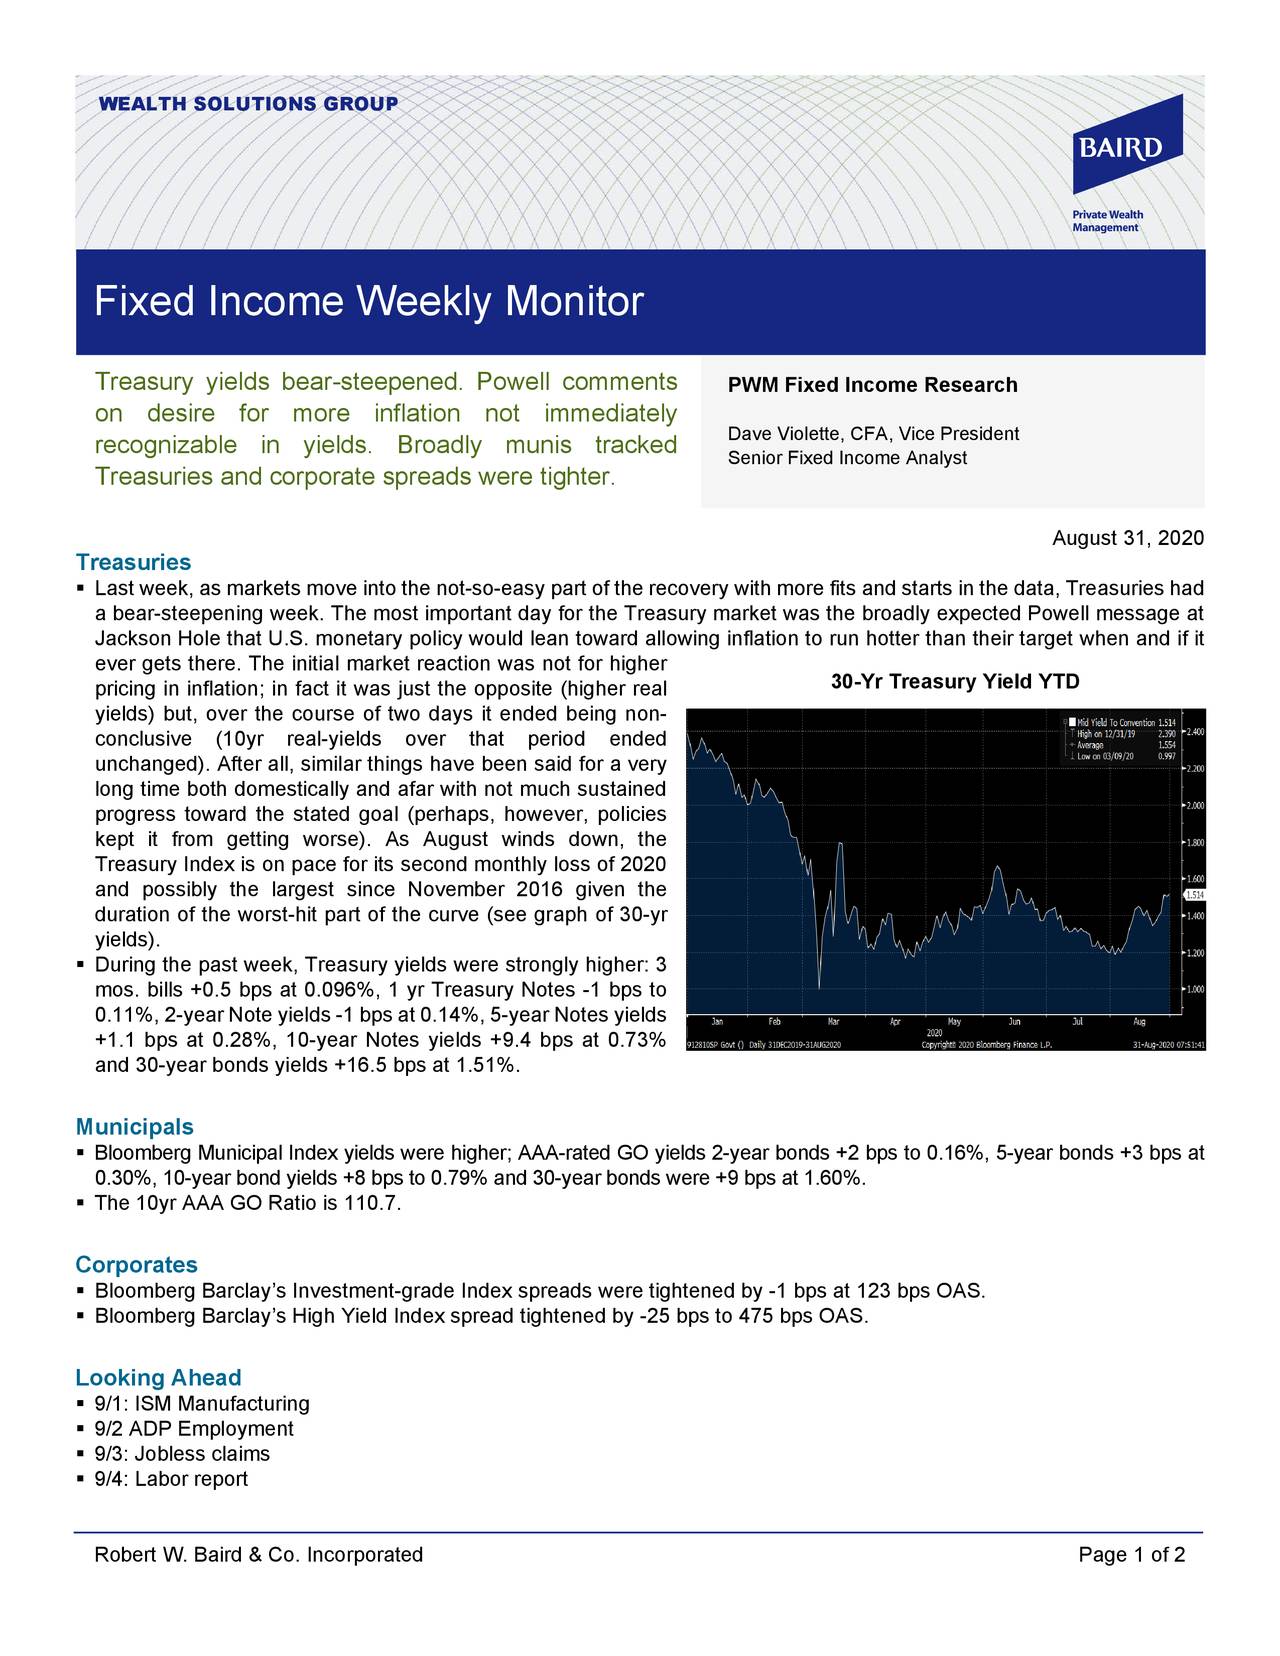
Treasuries Had A Bear-Steepening Week: Fixed Income Weekly Monitor, August 31, 2020

Rule #1 For Bonds: Don't Lose Money

Les batteries, une thématique porteuse pour les investisseurs en Bourse

BNY Mellon Municipal Bond Closed-End Funds Declare Distributions
Source: https://incomestatements.info
Category: Stock Reports

