See more : Sirtec International Co.,Ltd. (5356.TWO) Income Statement Analysis – Financial Results
Complete financial analysis of Ørsted A/S (DOGEF) income statement, including revenue, profit margins, EPS and key performance metrics. Get detailed insights into the financial performance of Ørsted A/S, a leading company in the Renewable Utilities industry within the Utilities sector.
- BPM Minerals Limited (BPM.AX) Income Statement Analysis – Financial Results
- Zhongjin Irradiation Incorporated Company (300962.SZ) Income Statement Analysis – Financial Results
- Pareto Bank ASA (0RI3.L) Income Statement Analysis – Financial Results
- FCCC, Inc. (FCIC) Income Statement Analysis – Financial Results
- StoneBridge Acquisition Corporation (APACU) Income Statement Analysis – Financial Results
Ørsted A/S (DOGEF)
About Ørsted A/S
Ørsted A/S, together with its subsidiaries, develops, constructs, owns, and operates offshore and onshore wind farms, solar farms, energy storage facilities, and bioenergy plants. It operates through Offshore, Onshore, and Markets & Bioenergy segments. The Offshore segment develops, constructs, owns, and operates offshore wind farms in the United Kingdom, Germany, Denmark, the Netherlands, the United States, Taiwan, Japan, and South Korea. The Onshore segment develops, owns, and operates onshore wind and solar farms in the United States. The Markets & Bioenergy segment engages in the generation of heat and power from combined heat and power plants in Denmark; sells power and gas in the wholesale and B2B markets; and optimizes and hedges energy portfolio. The company was formerly known as DONG Energy A/S and changed its name to Ørsted A/S in November 2017. Ørsted A/S was founded in 1972 and is headquartered in Fredericia, Denmark.
| Metric | 2023 | 2022 | 2021 | 2020 | 2019 | 2018 | 2017 | 2016 | 2015 | 2014 | 2013 | 2012 |
|---|---|---|---|---|---|---|---|---|---|---|---|---|
| Revenue | 69.08B | 126.09B | 69.14B | 37.10B | 59.34B | 68.65B | 59.71B | 57.39B | 74.39B | 71.83B | 72.20B | 65.86B |
| Cost of Revenue | 46.62B | 97.16B | 53.11B | 25.78B | 42.84B | 54.02B | 40.69B | 37.62B | 45.07B | 43.06B | 47.12B | 47.51B |
| Gross Profit | 22.45B | 28.93B | 16.03B | 11.32B | 16.50B | 14.63B | 19.02B | 19.77B | 29.32B | 28.77B | 25.08B | 18.35B |
| Gross Profit Ratio | 32.50% | 22.94% | 23.18% | 30.50% | 27.81% | 21.31% | 31.85% | 34.45% | 39.41% | 40.05% | 34.73% | 27.86% |
| Research & Development | 0.00 | 2.13B | 2.16B | 1.94B | 2.06B | 0.00 | 0.00 | 0.00 | 0.00 | 0.00 | 0.00 | 0.00 |
| General & Administrative | 0.00 | 7.05B | 5.76B | 5.77B | 6.09B | 5.87B | 4.24B | 4.08B | 3.26B | 0.00 | 0.00 | 0.00 |
| Selling & Marketing | 0.00 | 0.00 | 0.00 | 0.00 | 0.00 | 0.00 | 0.00 | 0.00 | 0.00 | 0.00 | 0.00 | 0.00 |
| SG&A | 16.09B | 7.05B | 5.76B | 5.77B | 6.09B | 5.87B | 4.24B | 4.08B | 3.26B | 10.48B | 10.45B | 11.78B |
| Other Expenses | 34.40B | 8.49B | 1.98B | -2.09B | -706.00M | -951.00M | 9.20B | 6.95B | 33.61B | 27.78B | 23.48B | 0.00 |
| Operating Expenses | 50.48B | 15.54B | 7.74B | 3.68B | 5.39B | 4.91B | 13.44B | 11.03B | 33.61B | 27.78B | 23.48B | 21.42B |
| Cost & Expenses | 86.93B | 112.70B | 60.85B | 29.47B | 48.22B | 58.93B | 54.14B | 48.65B | 78.68B | 70.84B | 70.60B | 68.94B |
| Interest Income | 637.00M | 368.00M | 335.00M | 823.00M | 291.00M | 326.00M | 287.00M | 459.00M | 718.00M | 672.00M | 564.00M | 1.10B |
| Interest Expense | 4.28B | 2.85B | 1.84B | 2.56B | 2.06B | 1.48B | 1.22B | 1.16B | 2.11B | 2.35B | 2.73B | 0.00 |
| Depreciation & Amortization | 9.80B | 9.75B | 7.97B | 7.59B | 6.86B | 5.98B | 5.74B | 5.23B | 25.73B | 17.57B | 12.96B | 9.07B |
| EBITDA | -4.95B | 25.63B | 16.14B | 15.59B | 19.21B | 13.50B | 11.86B | 9.54B | 10.03B | 21.74B | 15.11B | 7.04B |
| EBITDA Ratio | -7.17% | 20.33% | 23.35% | 42.02% | 32.37% | 22.25% | 19.96% | 24.81% | 29.60% | 26.55% | 19.77% | 10.69% |
| Operating Income | -17.85B | 13.37B | 8.04B | 9.01B | 11.59B | 9.90B | 16.29B | 11.71B | -3.81B | 2.77B | 1.24B | -2.02B |
| Operating Income Ratio | -25.85% | 10.60% | 11.63% | 24.29% | 19.53% | 14.42% | 27.28% | 20.40% | -5.12% | 3.85% | 1.71% | -3.07% |
| Total Other Income/Expenses | -1.17B | -2.17B | -2.92B | 8.31B | -1.20B | -1.15B | -1.19B | 475.00M | -1.36B | -941.00M | -1.81B | -2.15B |
| Income Before Tax | -19.03B | 17.61B | 13.28B | 17.32B | 10.39B | 21.97B | 15.10B | 12.18B | -5.93B | 1.83B | -576.00M | -4.18B |
| Income Before Tax Ratio | -27.54% | 13.97% | 19.20% | 46.69% | 17.51% | 32.00% | 25.29% | 21.23% | -7.97% | 2.54% | -0.80% | -6.34% |
| Income Tax Expense | 1.16B | 2.61B | 2.39B | 1.78B | 3.10B | 3.70B | 1.78B | 1.72B | 3.52B | 4.14B | 1.02B | 949.00M |
| Net Income | -20.51B | 15.13B | 10.96B | 15.60B | 6.51B | 17.83B | 18.72B | 7.55B | -9.48B | -2.39B | -1.56B | -4.69B |
| Net Income Ratio | -29.69% | 12.00% | 15.86% | 42.04% | 10.96% | 25.97% | 31.35% | 13.15% | -12.75% | -3.32% | -2.16% | -7.12% |
| EPS | -51.46 | 34.62 | 24.33 | 35.97 | 15.49 | 42.43 | 44.50 | 18.10 | -22.70 | -5.97 | -5.32 | -15.95 |
| EPS Diluted | -50.08 | 34.60 | 24.32 | 35.95 | 15.47 | 42.38 | 44.50 | 18.10 | -22.63 | -5.95 | -5.32 | -15.95 |
| Weighted Avg Shares Out | 409.19M | 420.21M | 420.15M | 420.06M | 420.08M | 420.14M | 420.16M | 419.01M | 417.73M | 400.16M | 293.71M | 293.71M |
| Weighted Avg Shares Out (Dil) | 420.51M | 420.44M | 420.38M | 420.36M | 420.49M | 420.61M | 420.43M | 420.31M | 419.04M | 401.47M | 293.71M | 293.71M |

Orsted A/S (DNNGY) Q4 2022 Earnings Call Transcript
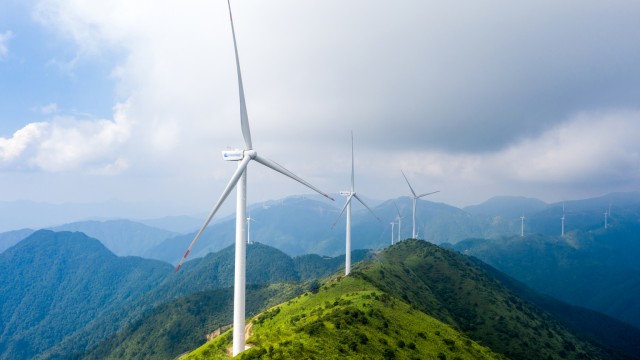
Ørsted: Class-Leading Renewables At A Fair Value

Orsted A/S (DNNGY) Q3 2022 Earnings Call Transcript
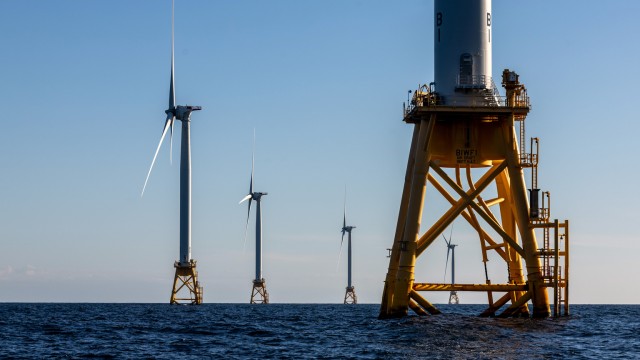
Ørsted: Go Long With The Inflation Reduction Act Signed

Orsted A/S (DNNGY) CEO Mads Nipper on Q2 2022 Results - Earnings Call Transcript
Hydrogen Stocks: Unstable, But Potentially Explosive, Too
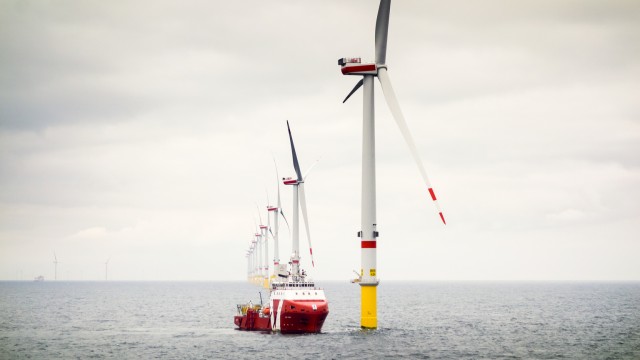
Ørsted, Big Wind, Change Coming: Energy Won't Just Mean Oil And Gas Soon
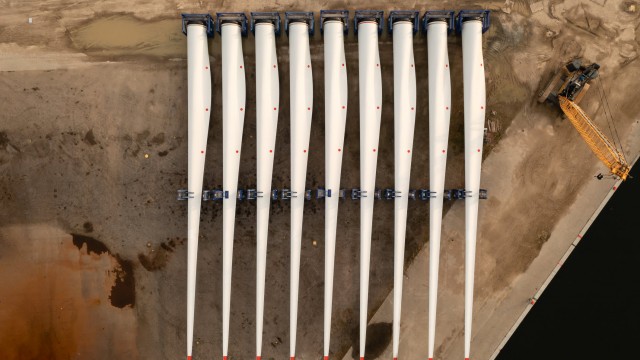
GE, Orsted and now Iberdrola: The competition to recycle wind turbine blades hots up
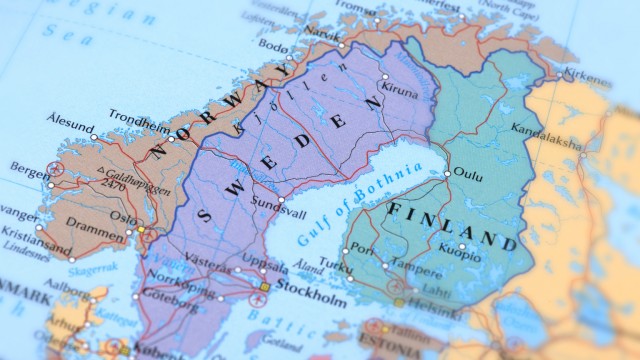
The Scandinavian Shopping List In A Time Of Bargains
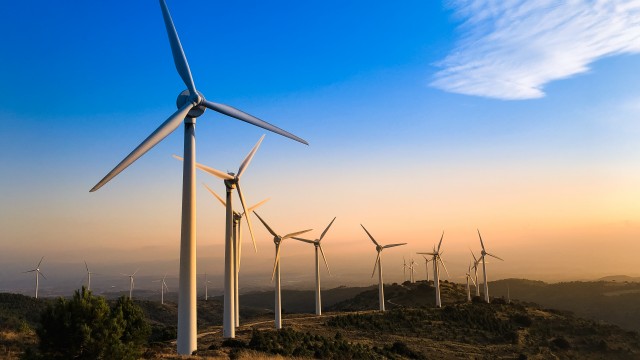
Ørsted A/S: A Government-Owned World Leader In Renewables
Source: https://incomestatements.info
Category: Stock Reports
