See more : Japan Post Insurance Co., Ltd. (JPPIF) Income Statement Analysis – Financial Results
Complete financial analysis of Deutsche Post AG (DPSGY) income statement, including revenue, profit margins, EPS and key performance metrics. Get detailed insights into the financial performance of Deutsche Post AG, a leading company in the Integrated Freight & Logistics industry within the Industrials sector.
- Shandong Kehui Power Automation Co.,Ltd. (688681.SS) Income Statement Analysis – Financial Results
- CLARA INDUSTRIES LIMITED (CLARA.BO) Income Statement Analysis – Financial Results
- Aartech Solonics Limited (AARTECH.NS) Income Statement Analysis – Financial Results
- Inhibikase Therapeutics, Inc. (IKT) Income Statement Analysis – Financial Results
- FS Bancorp, Inc. (FSBW) Income Statement Analysis – Financial Results
Deutsche Post AG (DPSGY)
About Deutsche Post AG
Deutsche Post AG operates as a mail and logistics company in Germany, rest of Europe, the Americas, the Asia Pacific, the Middle East, and Africa. The company operates through five segments: Express; Global Forwarding, Freight; Supply Chain; eCommerce Solutions; and Post & Parcel Germany. The Express segment offers time-definite courier and express services to business and private customers. The Global Forwarding, Freight segment provides air, ocean, and overland freight forwarding services; and offers multimodal and sector-specific solutions. This segment's business model is based on brokering transport services between customers and freight carriers. The Supply Chain segment delivers customized supply chain solutions to its customers based on modular components, including warehousing and transport services; and value-added services, such as e-fulfilment and returns management, lead logistics partner, real estate solutions, service logistics, and packaging solutions for various industrial sectors. The eCommerce Solutions segment provides parcel delivery and cross-border non-time definite international services. The Post & Parcel Germany segment transports and delivers mail communication, parcels, physical and hybrid letters, and special products for the delivery of goods; and offers additional services, such as registered mail, cash on delivery, and insured items. This segment also provides digital products, including stamps with data matrix codes and various postal services. Deutsche Post AG was founded in 1490 and is headquartered in Bonn, Germany.
| Metric | 2023 | 2022 | 2021 | 2020 | 2019 | 2018 | 2017 | 2016 | 2015 | 2014 | 2013 | 2012 | 2011 | 2010 | 2009 | 2008 | 2007 | 2006 | 2005 | 2004 | 2003 | 2002 | 2001 | 2000 | 1999 | 1998 | 1997 |
|---|---|---|---|---|---|---|---|---|---|---|---|---|---|---|---|---|---|---|---|---|---|---|---|---|---|---|---|
| Revenue | 81.76B | 94.44B | 81.75B | 66.81B | 63.34B | 61.55B | 60.44B | 57.33B | 59.23B | 56.63B | 55.09B | 55.51B | 52.83B | 51.48B | 46.20B | 54.47B | 63.51B | 60.55B | 44.59B | 43.17B | 40.02B | 39.26B | 33.38B | 32.71B | 22.36B | 15.68M | 15.04M |
| Cost of Revenue | 67.54B | 77.89B | 66.30B | 55.03B | 52.91B | 51.72B | 50.21B | 47.96B | 50.44B | 47.88B | 46.77B | 47.28B | 30.54B | 29.47B | 25.77B | 31.98B | 36.88B | 34.35B | 23.87B | 20.55B | 18.47B | 31.49B | 16.04B | 0.00 | 0.00 | 2.27M | 1.88M |
| Gross Profit | 14.21B | 16.55B | 15.44B | 11.77B | 10.43B | 9.83B | 10.24B | 9.38B | 8.79B | 8.75B | 8.31B | 8.24B | 22.29B | 22.01B | 20.43B | 22.50B | 26.64B | 26.20B | 20.73B | 22.62B | 21.55B | 7.76B | 17.34B | 32.71B | 22.36B | 13.42M | 13.16M |
| Gross Profit Ratio | 17.39% | 17.53% | 18.89% | 17.62% | 16.46% | 15.97% | 16.94% | 16.36% | 14.85% | 15.45% | 15.09% | 14.84% | 42.18% | 42.75% | 44.21% | 41.29% | 41.94% | 43.27% | 46.47% | 52.40% | 53.85% | 19.78% | 51.95% | 100.00% | 100.00% | 85.53% | 87.50% |
| Research & Development | 82.00M | 74.00M | 65.00M | 68.00M | 78.00M | 64.00M | 76.00M | 80.00M | 83.00M | 97.00M | 0.00 | 0.00 | 0.00 | 0.00 | 0.00 | 0.00 | 0.00 | 0.00 | 0.00 | 0.00 | 0.00 | 0.00 | 0.00 | 0.00 | 0.00 | 0.00 | 0.00 |
| General & Administrative | 669.00M | 868.00M | 842.00M | 757.00M | 771.00M | 954.00M | 940.00M | 928.00M | 1.04B | 854.00M | 909.00M | 858.00M | 0.00 | 16.61B | 17.02B | 0.00 | 0.00 | 0.00 | 0.00 | 13.74B | 13.33B | 0.00 | 0.00 | 0.00 | 0.00 | 0.00 | 0.00 |
| Selling & Marketing | 372.00M | 398.00M | 433.00M | 331.00M | 371.00M | 374.00M | 437.00M | 385.00M | 429.00M | 391.00M | 315.00M | 341.00M | 0.00 | 0.00 | 0.00 | 0.00 | 0.00 | 0.00 | 0.00 | 0.00 | 0.00 | 0.00 | 0.00 | 0.00 | 0.00 | 0.00 | 0.00 |
| SG&A | 1.04B | 1.27B | 1.28B | 1.09B | 1.14B | 1.33B | 1.38B | 1.31B | 1.47B | 1.25B | 1.22B | 1.20B | 0.00 | 16.61B | 17.02B | 0.00 | 0.00 | 0.00 | 0.00 | 13.74B | 13.33B | 0.00 | 0.00 | 0.00 | 0.00 | 0.00 | 0.00 |
| Other Expenses | 6.75B | 237.00M | 204.00M | 175.00M | 118.00M | 86.00M | 98.00M | 99.00M | 111.00M | 124.00M | 112.00M | 144.00M | 0.00 | 0.00 | 0.00 | 0.00 | 0.00 | 0.00 | -2.25B | 0.00 | 0.00 | 0.00 | 0.00 | -197.00M | 0.00 | 0.00 | 0.00 |
| Operating Expenses | 7.87B | 8.49B | 7.95B | 7.09B | 7.01B | 6.91B | 6.81B | 6.23B | 6.80B | 5.96B | 5.66B | 5.80B | 19.85B | 20.17B | 20.20B | 23.06B | 23.44B | 22.32B | 16.97B | 19.65B | 18.90B | 5.79B | 14.96B | 30.33B | 21.35B | -12.26M | -12.01M |
| Cost & Expenses | 75.41B | 86.38B | 74.26B | 62.13B | 59.93B | 58.63B | 57.01B | 54.19B | 57.24B | 53.83B | 52.43B | 53.08B | 50.39B | 49.65B | 45.97B | 55.04B | 60.31B | 56.67B | 40.84B | 40.19B | 37.36B | 37.28B | 31.00B | 30.33B | 21.35B | -9.99M | -10.13M |
| Interest Income | 247.00M | 209.00M | 101.00M | 74.00M | 100.00M | 64.00M | 55.00M | 54.00M | 46.00M | 43.00M | 92.00M | 48.00M | 590.00M | 2.25B | 1.89B | 621.00M | 998.00M | 198.00M | 219.00M | 362.00M | 0.00 | 0.00 | 0.00 | 0.00 | 75.00M | 43.00M | 0.00 |
| Interest Expense | 847.00M | 628.00M | 571.00M | 634.00M | 701.00M | 629.00M | 282.00M | 302.00M | 335.00M | 358.00M | 365.00M | 642.00M | 1.39B | 1.34B | 1.86B | 1.12B | 2.01B | 1.23B | 1.00B | 531.00M | 0.00 | 0.00 | 0.00 | 0.00 | 78.00M | 53.00M | 0.00 |
| Depreciation & Amortization | 4.48B | 4.13B | 3.76B | 3.72B | 3.64B | 3.28B | 1.44B | 1.35B | 1.67B | 1.38B | 1.34B | 1.34B | 1.27B | 1.30B | 1.62B | 2.66B | 2.36B | 1.77B | 1.91B | 1.84B | 1.69B | 1.89B | 171.00M | 144.00M | 72.00M | 787.19K | 799.88K |
| EBITDA | 10.84B | 12.73B | 11.69B | 8.54B | 7.77B | 6.44B | 5.18B | 4.77B | 3.71B | 4.32B | 4.14B | 3.58B | 3.59B | 5.46B | 2.25B | 2.31B | 4.44B | 5.85B | 5.67B | 4.81B | 4.37B | 3.87B | 2.55B | 2.38B | 991.00M | 929.00M | 25.97M |
| EBITDA Ratio | 13.26% | 13.21% | 13.92% | 12.77% | 11.37% | 10.27% | 7.96% | 7.89% | 6.27% | 7.47% | 7.51% | 6.45% | 8.18% | 10.60% | 8.12% | 4.99% | 10.33% | 9.65% | 12.71% | 11.15% | 10.91% | 9.85% | 7.65% | 7.71% | 4.51% | 168.71% | 172.70% |
| Operating Income | 6.35B | 8.44B | 7.62B | 4.85B | 4.13B | 3.16B | 3.74B | 3.49B | 2.41B | 2.97B | 2.86B | 2.67B | 2.44B | 1.84B | 231.00M | -567.00M | 3.20B | 3.87B | 3.76B | 2.98B | 2.66B | 1.97B | 2.38B | 2.24B | 939.00M | 25.67M | 25.17M |
| Operating Income Ratio | 7.76% | 8.93% | 9.32% | 7.26% | 6.52% | 5.14% | 6.19% | 6.09% | 4.07% | 5.24% | 5.19% | 4.80% | 4.61% | 3.56% | 0.50% | -1.04% | 5.04% | 6.40% | 8.42% | 6.90% | 6.64% | 5.02% | 7.14% | 6.83% | 4.20% | 163.69% | 167.38% |
| Total Other Income/Expenses | -829.00M | -525.00M | -619.00M | -676.00M | -654.00M | -218.00M | -411.00M | -359.00M | -13.00M | -153.00M | -13.00M | -456.00M | -777.00M | 933.00M | 17.00M | -499.00M | -945.00M | -1.03B | -711.00M | -845.00M | -741.00M | -664.00M | -229.00M | -197.00M | -163.00M | 43.00M | -25.16M |
| Income Before Tax | 5.52B | 7.91B | 7.36B | 4.17B | 3.47B | 2.59B | 3.33B | 3.13B | 2.06B | 2.58B | 2.57B | 2.24B | 1.66B | 2.82B | 276.00M | -1.07B | 2.19B | 2.84B | 3.05B | 2.16B | 1.92B | 1.86B | 2.15B | 2.04B | 859.00M | 45.52K | 4.55K |
| Income Before Tax Ratio | 6.75% | 8.38% | 9.00% | 6.24% | 5.48% | 4.20% | 5.51% | 5.46% | 3.47% | 4.55% | 4.67% | 4.03% | 3.14% | 5.49% | 0.60% | -1.96% | 3.45% | 4.69% | 6.85% | 4.99% | 4.79% | 4.73% | 6.45% | 6.23% | 3.84% | 0.29% | 0.03% |
| Income Tax Expense | 1.58B | 2.19B | 1.94B | 995.00M | 698.00M | 362.00M | 477.00M | 351.00M | 338.00M | 400.00M | 361.00M | 458.00M | 393.00M | 194.00M | 15.00M | 200.00M | 307.00M | 560.00M | -605.00M | 431.00M | 573.00M | 266.00M | 560.00M | -511.00M | -253.00M | -117.13K | -198.71K |
| Net Income | 3.68B | 5.36B | 5.05B | 2.98B | 2.62B | 2.08B | 2.71B | 2.64B | 1.54B | 2.07B | 2.09B | 1.66B | 1.27B | 2.54B | 644.00M | -1.98B | 1.89B | 2.28B | 2.24B | 1.59B | 1.34B | 659.00M | 1.58B | 1.51B | 1.12B | 162.65K | 203.26K |
| Net Income Ratio | 4.50% | 5.67% | 6.18% | 4.46% | 4.14% | 3.37% | 4.49% | 4.60% | 2.60% | 3.66% | 3.80% | 2.99% | 2.40% | 4.94% | 1.39% | -3.63% | 2.97% | 3.77% | 5.01% | 3.68% | 3.35% | 1.68% | 4.74% | 4.62% | 4.99% | 1.04% | 1.35% |
| EPS | 3.10 | 4.41 | 4.10 | 2.41 | 2.13 | 1.69 | 2.24 | 2.19 | 1.27 | 1.71 | 1.73 | 1.36 | 0.96 | 2.10 | 0.53 | -1.64 | 1.15 | 1.60 | 1.99 | 1.44 | 1.18 | 0.59 | 1.42 | 1.36 | 0.92 | 0.83 | 0.00 |
| EPS Diluted | 3.04 | 4.33 | 4.01 | 2.36 | 2.09 | 1.66 | 2.15 | 2.10 | 1.22 | 1.64 | 1.66 | 1.30 | 0.96 | 2.10 | 0.53 | -1.64 | 1.15 | 1.60 | 1.99 | 1.44 | 1.18 | 0.59 | 1.42 | 1.36 | 0.92 | 0.83 | 0.00 |
| Weighted Avg Shares Out | 1.19B | 1.21B | 1.23B | 1.24B | 1.23B | 1.23B | 1.21B | 1.20B | 1.21B | 1.21B | 1.21B | 1.21B | 1.21B | 1.21B | 1.21B | 1.21B | 1.21B | 1.20B | 1.12B | 1.11B | 1.11B | 1.11B | 1.11B | 1.11B | 1.11B | 1.11B | 1.11B |
| Weighted Avg Shares Out (Dil) | 1.21B | 1.24B | 1.26B | 1.27B | 1.26B | 1.25B | 1.26B | 1.26B | 1.26B | 1.26B | 1.26B | 1.26B | 1.21B | 1.21B | 1.21B | 1.21B | 1.21B | 1.20B | 1.12B | 1.11B | 1.11B | 1.11B | 1.11B | 1.11B | 1.11B | 1.11B | 1.11B |

Deutsche Post DHL: A Value Investor's Dream Stock
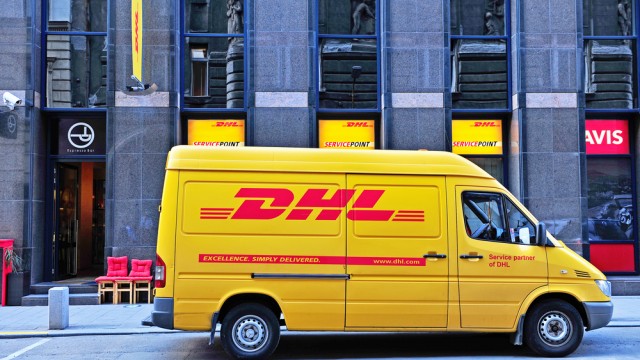
DHL beats out Parcelforce and UPS as Britain's least reliable courier

Embark, DHL Supply Chain tackle autonomous trucking roadblocks through long-standing partnership

Deutsche Post: The Stock Continues To Look Undervalued
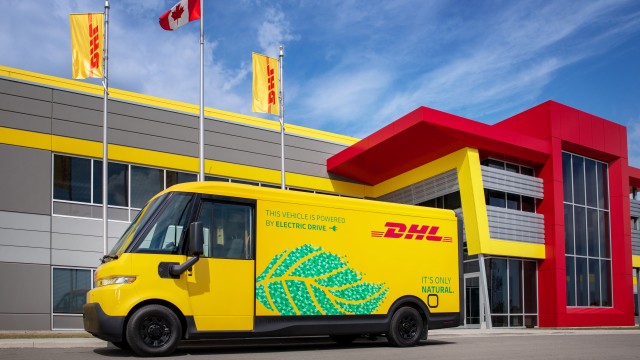
BrightDrop expands e-delivery van business to Canada with DHL Express

BrightDrop adds DHL Express as EV customer, announces start of production at CAMI plant

Ford Is Selling EVs to DHL. The Vehicles Aren't the Important Part of the Deal.
Deutsche Post DHL posts 20% top-line gain in Q3

Deutsche Post AG (DPSTF) Q3 2022 Earnings Call Transcript

Deutsche Post lifts guidance after forecast-beating profit and revenue
Source: https://incomestatements.info
Category: Stock Reports
