See more : EonX Technologies Inc. (EONX.CN) Income Statement Analysis – Financial Results
Complete financial analysis of Dassault Aviation Société anonyme (DUAVF) income statement, including revenue, profit margins, EPS and key performance metrics. Get detailed insights into the financial performance of Dassault Aviation Société anonyme, a leading company in the Aerospace & Defense industry within the Industrials sector.
- Global Mixed-Mode Technology Inc. (8081.TW) Income Statement Analysis – Financial Results
- Kitahama Capital Partners Co.,Ltd. (2134.T) Income Statement Analysis – Financial Results
- Couchbase, Inc. (BASE) Income Statement Analysis – Financial Results
- Shenzhen Original Advanced Compounds Co., Ltd. (603991.SS) Income Statement Analysis – Financial Results
- Sears Holdings Corporation (SHLDQ) Income Statement Analysis – Financial Results
Dassault Aviation Société anonyme (DUAVF)
About Dassault Aviation Société anonyme
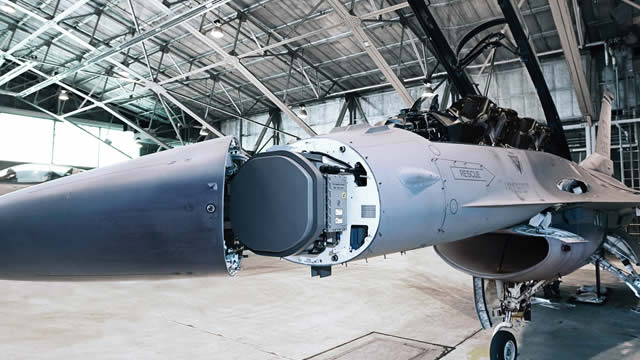
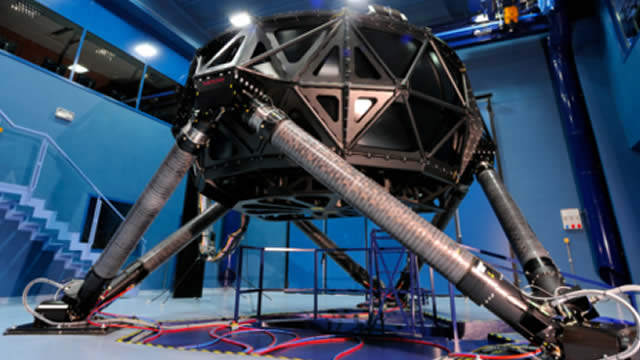
Dassault Aviation Société anonyme designs and builds military aircraft, business jets, and space systems in France, the Americas, and internationally. It offers Rafale, a multirole fighter aircraft; nEUROn, an unmanned combat air vehicle; and Falcon aircraft for maritime surveillance, intelligence, and medical evacuation missions. The company operates a fleet of 2,100 Falcon jets and 1,000 fighter aircraft. In addition, it provides aviation maintenance and training services; repairs and maintains landing gears and flight controls; overhauls and repairs civil aviation equipment; leases and manages Falcon aircraft as part of public passenger transport activity; and designs, produces, and distributes simulation tools. The company was founded in 1916 and is headquartered in Paris, France. Dassault Aviation Société anonyme is a subsidiary of Groupe Industriel Marcel Dassault S.A.
| Metric | 2023 | 2022 | 2021 | 2020 | 2019 | 2018 | 2017 | 2016 | 2015 | 2014 | 2013 | 2012 | 2011 | 2010 | 2009 | 2008 | 2007 | 2006 | 2005 | 2004 | 2003 | 2002 |
|---|---|---|---|---|---|---|---|---|---|---|---|---|---|---|---|---|---|---|---|---|---|---|
| Revenue | 4.96B | 6.95B | 7.25B | 5.49B | 7.37B | 5.12B | 4.83B | 3.67B | 4.18B | 3.68B | 4.59B | 3.95B | 3.31B | 4.19B | 3.42B | 3.76B | 4.11B | 3.35B | 3.43B | 3.59B | 3.72B | 4.09B |
| Cost of Revenue | 3.00B | 4.77B | 4.86B | 4.00B | 5.00B | 3.34B | 3.12B | 2.05B | 2.70B | 2.32B | 2.77B | 2.25B | 1.88B | 622.44M | 73.07M | -464.54M | -221.41M | -374.09M | 234.25M | 396.39M | 0.00 | 0.00 |
| Gross Profit | 1.96B | 2.18B | 2.38B | 1.49B | 2.37B | 1.78B | 1.72B | 1.62B | 1.49B | 1.36B | 1.82B | 1.69B | 1.43B | 3.56B | 3.35B | 4.22B | 4.33B | 3.73B | 3.19B | 3.19B | 3.72B | 4.09B |
| Gross Profit Ratio | 39.56% | 31.31% | 32.91% | 27.11% | 32.10% | 34.76% | 35.54% | 44.06% | 35.52% | 37.06% | 39.70% | 42.93% | 43.12% | 85.13% | 97.86% | 112.37% | 105.39% | 111.16% | 93.17% | 88.95% | 100.00% | 100.00% |
| Research & Development | 483.02M | 571.98M | 551.37M | 537.78M | 527.29M | 391.78M | 312.54M | 292.71M | 431.16M | 488.06M | 481.56M | 0.00 | 0.00 | 0.00 | 0.00 | 0.00 | 0.00 | 0.00 | 0.00 | 0.00 | 0.00 | 0.00 |
| General & Administrative | 0.00 | 0.00 | 0.00 | 0.00 | 0.00 | 0.00 | 0.00 | 2.55B | 2.99B | 2.43B | 2.62B | 2.22B | 0.00 | 1.63B | 1.70B | 2.28B | 2.62B | 2.23B | 1.77B | 2.51B | 2.69B | 2.98B |
| Selling & Marketing | 0.00 | 0.00 | 0.00 | 0.00 | 0.00 | 0.00 | 0.00 | 0.00 | 0.00 | 0.00 | 0.00 | 0.00 | 0.00 | 0.00 | 0.00 | 0.00 | 0.00 | 0.00 | 0.00 | 0.00 | 0.00 | 0.00 |
| SG&A | 1.47B | -560.62M | -2.29M | -2.84M | 7.77M | 731.00K | 4.61M | 2.55B | 2.99B | 2.43B | 2.62B | 2.22B | 0.00 | 1.63B | 1.70B | 2.28B | 2.62B | 2.23B | 1.77B | 2.51B | 2.69B | 2.98B |
| Other Expenses | -337.10M | -24.62M | -456.74M | 129.26M | -151.65M | 241.00M | -133.50M | -108.46M | 92.60M | 0.00 | 0.00 | 8.69M | 0.00 | 0.00 | -65.55M | -32.00K | -18.00K | -13.00K | -8.00K | -59.00K | -62.00K | -93.00K |
| Operating Expenses | 1.61B | 1.58B | 1.85B | 1.20B | 1.57B | 1.31B | 1.35B | 1.33B | 1.14B | 1.04B | 1.32B | 1.16B | 1.05B | 2.97B | 4.30B | 3.79B | 3.83B | 3.35B | 2.78B | 3.12B | 3.32B | 3.61B |
| Cost & Expenses | 4.61B | 6.35B | 6.71B | 5.20B | 6.58B | 4.65B | 4.46B | 3.38B | 3.84B | 3.36B | 4.09B | 3.41B | 2.93B | 3.60B | 4.37B | 3.32B | 3.60B | 2.98B | 3.02B | 3.12B | 3.32B | 3.61B |
| Interest Income | 49.18M | 48.44M | 7.50M | 9.77M | 21.73M | 14.17M | 304.65M | 107.76M | 200.82M | 48.68M | 23.56M | 24.35M | 37.71M | 12.69M | 53.56M | 18.62M | 0.00 | 0.00 | 0.00 | 0.00 | 0.00 | 0.00 |
| Interest Expense | 6.35M | 4.13M | 3.94M | 41.74M | 75.11M | 94.70M | 11.90M | 15.53M | 16.02M | 7.31M | 6.99M | 12.44M | 23.73M | 39.34M | 34.96M | 14.59M | 0.00 | 0.00 | 0.00 | 0.00 | 0.00 | 0.00 |
| Depreciation & Amortization | 174.45M | 174.53M | 151.84M | 156.88M | 142.50M | 82.21M | 87.27M | 84.50M | -63.43M | 71.20M | 75.85M | 72.25M | 45.49M | 293.99M | 146.60M | 300.34M | 198.18M | 118.06M | 58.98M | 60.31M | 66.31M | 70.01M |
| EBITDA | 1.01B | 773.54M | 691.13M | 445.09M | 936.60M | 548.79M | 466.45M | 374.15M | 170.75M | 392.04M | 580.04M | 812.15M | 537.49M | 770.03M | 571.12M | 734.51M | 701.56M | 489.78M | 470.58M | 524.41M | 471.40M | 542.51M |
| EBITDA Ratio | 20.27% | 15.34% | 18.95% | 10.99% | 16.87% | 23.89% | 22.79% | 15.15% | 4.10% | 11.72% | 16.27% | 20.77% | 16.26% | 18.39% | 15.72% | 19.55% | 17.08% | 14.62% | 13.73% | 14.62% | 12.66% | 13.28% |
| Operating Income | 349.48M | 591.40M | 545.07M | 246.16M | 796.25M | 707.53M | 209.72M | 285.53M | 361.19M | 352.75M | 498.50M | 546.99M | 376.50M | 591.27M | 391.17M | 434.17M | 503.39M | 371.73M | 411.60M | 464.10M | 405.09M | 472.50M |
| Operating Income Ratio | 7.04% | 8.51% | 7.52% | 4.48% | 10.80% | 13.82% | 4.34% | 7.79% | 8.63% | 9.58% | 10.85% | 13.86% | 11.39% | 14.12% | 11.43% | 11.56% | 12.26% | 11.09% | 12.01% | 12.94% | 10.88% | 11.57% |
| Total Other Income/Expenses | 478.19M | 270.79M | 203.10M | 133.50M | 163.05M | 59.97M | 758.11M | 169.51M | -281.45M | 9.60M | 165.51M | 188.33M | 55.04M | -154.57M | -69.73M | 60.65M | 61.74M | 45.01M | 30.73M | 1.86M | 34.07M | -6.75M |
| Income Before Tax | 827.66M | 862.20M | 748.17M | 379.66M | 959.30M | 767.50M | 976.05M | 455.04M | 79.74M | 362.35M | 664.01M | 735.32M | 431.54M | 436.70M | 356.20M | 494.81M | 565.13M | 416.74M | 442.33M | 465.96M | 439.16M | 465.75M |
| Income Before Tax Ratio | 16.67% | 12.41% | 10.32% | 6.91% | 13.02% | 14.99% | 20.20% | 12.41% | 1.91% | 9.85% | 14.46% | 18.64% | 13.06% | 10.43% | 10.41% | 13.17% | 13.76% | 12.44% | 12.90% | 12.99% | 11.80% | 11.40% |
| Income Tax Expense | 134.26M | 145.97M | 142.78M | 76.90M | 246.58M | 194.69M | 267.06M | 75.97M | -61.76M | 79.48M | 204.56M | 225.44M | 108.88M | 169.21M | 99.48M | 121.86M | 182.85M | 135.51M | 137.61M | 155.43M | 139.66M | 174.36M |
| Net Income | 693.40M | 716.23M | 605.39M | 302.76M | 712.70M | 572.74M | 630.04M | 379.03M | 141.46M | 282.84M | 459.42M | 501.98M | 322.63M | 267.45M | 256.72M | 384.19M | 382.28M | 281.22M | 304.72M | 312.59M | 294.72M | 312.35M |
| Net Income Ratio | 13.97% | 10.31% | 8.35% | 5.51% | 9.67% | 11.19% | 13.04% | 10.34% | 3.38% | 7.68% | 10.00% | 12.72% | 9.76% | 6.39% | 7.50% | 10.23% | 9.31% | 8.39% | 8.89% | 8.71% | 7.92% | 7.65% |
| EPS | 8.57 | 8.62 | 7.28 | 3.64 | 8.57 | 6.91 | 7.64 | 4.50 | 1.60 | 2.82 | 4.54 | 4.96 | 3.19 | 2.64 | 2.54 | 3.79 | 3.78 | 2.78 | 3.01 | 3.09 | 2.91 | 3.08 |
| EPS Diluted | 8.57 | 8.62 | 7.28 | 3.64 | 8.57 | 6.91 | 7.64 | 4.50 | 1.60 | 2.82 | 4.54 | 4.96 | 3.19 | 2.64 | 2.54 | 3.79 | 3.78 | 2.78 | 3.01 | 3.09 | 2.91 | 3.08 |
| Weighted Avg Shares Out | 80.93M | 83.12M | 83.17M | 83.15M | 83.13M | 82.93M | 82.45M | 84.31M | 88.17M | 100.14M | 101.26M | 101.26M | 101.26M | 101.26M | 101.26M | 101.26M | 101.26M | 101.26M | 101.26M | 101.26M | 101.26M | 101.26M |
| Weighted Avg Shares Out (Dil) | 80.95M | 83.13M | 83.19M | 83.16M | 83.14M | 82.94M | 82.45M | 84.32M | 88.18M | 100.14M | 101.26M | 101.26M | 101.26M | 101.26M | 101.26M | 101.26M | 101.26M | 101.26M | 101.26M | 101.26M | 101.26M | 101.26M |

Dassault Aviation: 21% EBITDA Growth Supported By Strong Jet Demand

Dassault Aviation becomes a Patron of the Charles de Gaulle Foundation

Dassault Aviation: Unmanned combat aerial vehicle program kicks off as part of the Rafale F5 standard

Dassault Aviation: Latent And Current Growth

Dassault Aviation: Serbia acquires 12 Rafale fighters

Serbia, France's Dassault Aviation sign agreement on purchase of Rafale fighter jets

Dassault Aviation: Half Year Financial Release 2024

Dassault Aviation's H1 net sales climb, despite ongoing supply chain issues

Dassault Aviation: Description of share buyback program autorized by GM 16 May 2024

Dassault Aviation: Half Year Financial Release 2024
Source: https://incomestatements.info
Category: Stock Reports
