See more : China Eastern Airlines Corporation Limited (CHEAF) Income Statement Analysis – Financial Results
Complete financial analysis of Dufry AG (DUFRY) income statement, including revenue, profit margins, EPS and key performance metrics. Get detailed insights into the financial performance of Dufry AG, a leading company in the Specialty Retail industry within the Consumer Cyclical sector.
- Nova Eye Medical Limited (ELXMF) Income Statement Analysis – Financial Results
- COSCO SHIPPING Holdings Co., Ltd. (CICOF) Income Statement Analysis – Financial Results
- Electricité et Eaux de Madagascar Société Anonyme (EEM.PA) Income Statement Analysis – Financial Results
- Hangzhou Tigermed Consulting Co., Ltd. (300347.SZ) Income Statement Analysis – Financial Results
- Jianzhi Education Technology Group Company Limited (JZ) Income Statement Analysis – Financial Results
Dufry AG (DUFRY)
About Dufry AG
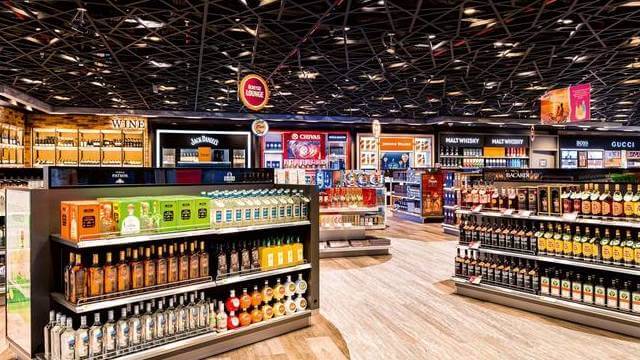
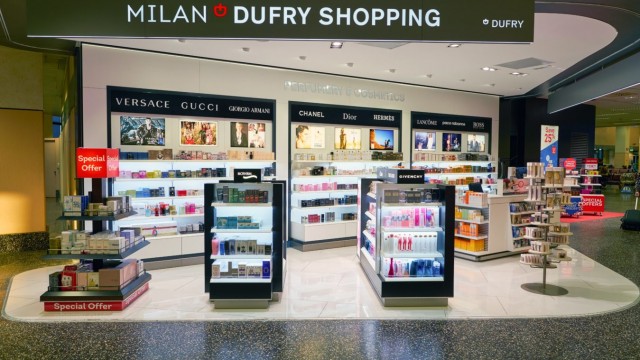
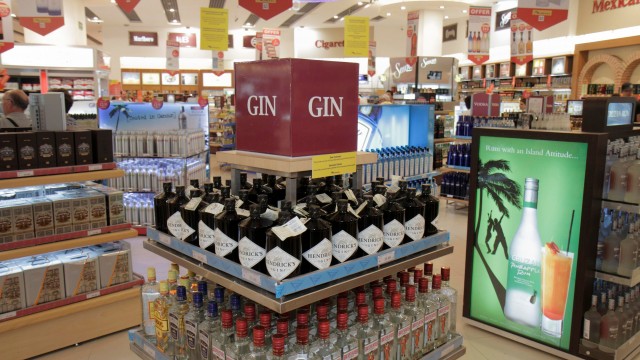
Dufry AG operates as a travel retailer. The company's retail brands include general travel retail shops under the Dufry, World Duty Free, Nuance, Hellenic Duty Free, Colombian Emeralds, Duty Free Uruguay, Hudson, Duty Free Shop Argentina, and RegStaer brands; Dufry shopping stores; brand boutiques; convenience stores primarily under the Hudson brand; and specialized shops and theme stores. Its travel retail shops offer perfumes and cosmetics, food and confectionery, wines and spirits, watches and jewelry, fashion and leather, tobacco goods, souvenirs, electronics, soft drinks, packaged food, travel accessories, personal items, sunglasses, destination merchandise, and other products, as well as newspapers, magazines, and books. As of March 15, 2022, the company operated approximately 2,300 duty-free and duty-paid shops located at airports, cruise liners, seaports, railway stations, and downtown tourist areas worldwide. Dufry AG was incorporated in 1865 and is headquartered in Basel, Switzerland.
| Metric | 2023 | 2022 | 2021 | 2020 | 2019 | 2018 | 2017 | 2016 | 2015 | 2014 | 2013 | 2012 | 2011 | 2010 | 2009 | 2008 | 2007 | 2006 | 2005 |
|---|---|---|---|---|---|---|---|---|---|---|---|---|---|---|---|---|---|---|---|
| Revenue | 12.79B | 6.88B | 3.92B | 2.56B | 8.85B | 8.68B | 8.38B | 7.83B | 6.14B | 4.20B | 3.57B | 3.15B | 2.64B | 2.61B | 2.38B | 2.11B | 1.93B | 1.44B | 949.83M |
| Cost of Revenue | 4.90B | 2.68B | 1.70B | 1.18B | 3.53B | 3.49B | 3.40B | 3.25B | 2.56B | 1.73B | 1.47B | 1.30B | 1.10B | 1.11B | 1.05B | 961.67M | 902.24M | 691.93M | 477.62M |
| Gross Profit | 7.89B | 4.19B | 2.21B | 1.38B | 5.32B | 5.20B | 4.98B | 4.58B | 3.57B | 2.46B | 2.11B | 1.86B | 1.54B | 1.50B | 1.33B | 1.15B | 1.03B | 744.37M | 472.22M |
| Gross Profit Ratio | 61.72% | 60.97% | 56.47% | 53.78% | 60.16% | 59.82% | 59.43% | 58.55% | 58.23% | 58.69% | 58.96% | 58.87% | 58.21% | 57.54% | 55.89% | 54.50% | 53.26% | 51.83% | 49.72% |
| Research & Development | 0.00 | 0.00 | 0.00 | 0.00 | 0.00 | 0.00 | 0.00 | 0.00 | 0.00 | 0.00 | 0.00 | 0.00 | 0.00 | 0.00 | 0.00 | 0.00 | 0.00 | 0.00 | 0.00 |
| General & Administrative | 4.42B | 126.90M | 84.00M | 86.40M | 104.50M | 290.90M | 415.50M | 381.70M | 336.00M | 272.80M | 243.50M | 222.80M | 182.10M | 175.10M | 156.10M | 144.88M | -308.85M | -218.45M | -120.28M |
| Selling & Marketing | 32.30M | 55.00M | 35.30M | 28.20M | 78.50M | 156.40M | 2.43B | 2.24B | 1.68B | 1.02B | 826.00M | 694.20M | 579.70M | 584.80M | 510.90M | 437.47M | 405.53M | 297.02M | 178.37M |
| SG&A | 4.46B | 181.90M | 119.30M | 114.60M | 183.00M | 447.30M | 2.85B | 2.62B | 2.02B | 1.30B | 1.07B | 917.00M | 761.80M | 759.90M | 667.00M | 582.35M | 96.68M | 78.57M | 58.09M |
| Other Expenses | 2.57B | 3.59B | 2.73B | 2.56B | 4.65B | 17.80M | 1.42B | 1.47B | 1.16B | 730.60M | 628.60M | 560.30M | 1.70M | 544.10M | -2.90M | -9.04M | 790.75M | 690.88M | -796.00K |
| Operating Expenses | 7.03B | 3.77B | 2.85B | 2.68B | 4.83B | 4.80B | 4.48B | 4.30B | 3.36B | 2.16B | 1.80B | 1.57B | 1.32B | 1.30B | 1.17B | 956.73M | 887.43M | 769.45M | 402.72M |
| Cost & Expenses | 11.92B | 6.46B | 4.55B | 3.86B | 8.36B | 8.29B | 7.87B | 7.54B | 5.92B | 3.89B | 3.27B | 2.87B | 2.43B | 2.41B | 2.22B | 1.92B | 1.79B | 1.46B | 880.34M |
| Interest Income | 36.60M | 30.50M | 15.60M | 22.60M | 28.80M | 28.50M | 25.70M | 23.40M | 11.10M | 5.30M | 3.00M | 1.30M | 4.10M | 4.80M | 5.70M | 6.46M | 4.31M | 2.06M | 554.00K |
| Interest Expense | 533.90M | 284.60M | 252.20M | 331.60M | 351.10M | 165.70M | 201.60M | 217.20M | 157.20M | 122.50M | 83.30M | 64.90M | 55.20M | 37.00M | 46.20M | 44.69M | 40.37M | 35.74M | 7.85M |
| Depreciation & Amortization | 1.64B | 1.11B | 1.21B | 1.65B | 1.72B | 545.50M | 519.50M | 539.30M | 444.80M | 249.10M | 192.90M | 168.30M | 131.50M | 129.50M | 123.00M | 86.39M | 70.19M | 50.05M | 23.67M |
| EBITDA | 2.47B | 1.59B | 532.60M | -890.90M | 2.18B | 941.10M | 1.01B | 821.60M | 555.20M | 478.40M | 492.40M | 430.80M | 337.00M | 332.20M | 289.20M | 279.00M | 259.88M | 224.24M | 97.64M |
| EBITDA Ratio | 19.32% | 22.04% | 13.60% | 12.11% | 25.89% | 11.69% | 12.77% | 10.70% | 10.48% | 12.32% | 13.36% | 14.04% | 13.26% | 12.73% | 12.16% | 13.20% | 13.46% | 11.16% | 10.07% |
| Operating Income | 865.10M | 404.70M | -677.40M | -1.34B | 432.80M | 399.10M | 503.40M | 286.40M | 216.90M | 302.50M | 300.90M | 287.80M | 212.50M | 197.90M | 163.40M | 195.13M | 192.32M | 169.20M | 71.48M |
| Operating Income Ratio | 6.76% | 5.88% | -17.30% | -52.26% | 4.89% | 4.60% | 6.01% | 3.66% | 3.53% | 7.21% | 8.42% | 9.13% | 8.06% | 7.58% | 6.87% | 9.23% | 9.96% | 11.78% | 7.53% |
| Total Other Income/Expenses | -567.10M | -305.60M | -341.60M | -370.40M | -324.50M | -164.90M | -291.90M | -235.40M | -263.70M | -196.60M | -120.10M | -90.70M | -49.40M | -32.20M | -43.40M | -47.27M | -27.93M | -30.74M | -5.35M |
| Income Before Tax | 298.00M | 196.80M | -407.80M | -2.87B | 108.30M | 234.20M | 201.90M | 57.10M | -46.80M | 105.90M | 180.80M | 197.30M | 163.10M | 165.70M | 120.00M | 147.86M | 164.39M | 138.46M | 66.13M |
| Income Before Tax Ratio | 2.33% | 2.86% | -10.42% | -112.11% | 1.22% | 2.70% | 2.41% | 0.73% | -0.76% | 2.52% | 5.06% | 6.26% | 6.18% | 6.35% | 5.04% | 7.00% | 8.52% | 9.64% | 6.96% |
| Income Tax Expense | 81.60M | 76.20M | -42.60M | -130.70M | 78.20M | 98.80M | 91.00M | 11.30M | -10.10M | 20.30M | 33.20M | 39.10M | 28.20M | 20.90M | 22.70M | 30.11M | 38.35M | 13.88M | 13.44M |
| Net Income | 87.30M | 58.20M | -385.40M | -2.74B | 30.10M | 71.80M | 56.80M | 2.50M | -79.30M | 51.60M | 93.00M | 122.50M | 111.90M | 116.60M | 97.30M | 117.76M | 67.49M | 107.71M | 41.56M |
| Net Income Ratio | 0.68% | 0.85% | -9.84% | -107.00% | 0.34% | 0.83% | 0.68% | 0.03% | -1.29% | 1.23% | 2.60% | 3.88% | 4.24% | 4.47% | 4.09% | 5.57% | 3.50% | 7.50% | 4.38% |
| EPS | 0.63 | 0.06 | -0.44 | -4.69 | 0.06 | 0.14 | 0.10 | 0.01 | -0.17 | 0.15 | 0.31 | 0.44 | 0.49 | 0.56 | 0.50 | 0.77 | 0.52 | 0.75 | 0.39 |
| EPS Diluted | 0.63 | 0.06 | -0.44 | -4.69 | 0.06 | 0.13 | 0.10 | 0.01 | -0.17 | 0.14 | 0.31 | 0.43 | 0.49 | 0.56 | 0.49 | 0.76 | 0.52 | 0.74 | 0.39 |
| Weighted Avg Shares Out | 138.57M | 928.00M | 877.84M | 584.50M | 498.86M | 530.05M | 549.60M | 549.54M | 468.14M | 340.37M | 303.72M | 280.49M | 274.62M | 257.18M | 196.21M | 152.27M | 143.25M | 143.71M | 106.83M |
| Weighted Avg Shares Out (Dil) | 139.36M | 940.11M | 877.84M | 584.50M | 498.86M | 533.01M | 551.63M | 549.74M | 468.14M | 350.55M | 304.91M | 283.91M | 274.62M | 260.05M | 199.28M | 154.31M | 145.35M | 144.74M | 106.83M |

Dufry's turnover more than doubles as sales inch towards 2019 levels

Here is why Dufry shares jumped 8%

Dufry Set To Buy Autogrill And Create New $6.7 Billion Travel Retail Powerhouse

Dufry to acquire Italy's Autogrill

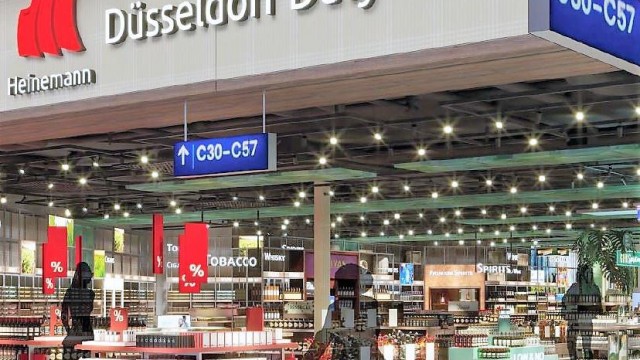
Dufry Loses Retail Toehold In Germany As Heinemann Returns To Country's Fourth Busiest Airport

London Heathrow Airport Revises 2022 Traffic Upwards By 16% And Extends Dufry's Retail Contract

Dufry: FCF Ahead Of Q1 2019, Plus A Potential Business Combination

Dufry's Stock Slides On Q1 Results, But Is The Gloom Lifting?

Dufry: Thoughts Ahead Of FY 2022

Can Mexico Lead A Revival Of Dufry's Travel Retail Business?
Source: https://incomestatements.info
Category: Stock Reports
