See more : TPI Polene Public Company Limited (TPIPL.BK) Income Statement Analysis – Financial Results
Complete financial analysis of Dunxin Financial Holdings Limited (DXF) income statement, including revenue, profit margins, EPS and key performance metrics. Get detailed insights into the financial performance of Dunxin Financial Holdings Limited, a leading company in the Financial – Credit Services industry within the Financial Services sector.
- Redbox Entertainment Inc. (RDBX) Income Statement Analysis – Financial Results
- Dayou Plus Co.,Ltd (000300.KS) Income Statement Analysis – Financial Results
- Chien Shing Stainless Steel Co., Ltd. (2025.TW) Income Statement Analysis – Financial Results
- Alacrity Securities Limited (ALSL.BO) Income Statement Analysis – Financial Results
- Chambal Fertilisers and Chemicals Limited (CHAMBLFERT.BO) Income Statement Analysis – Financial Results
Dunxin Financial Holdings Limited (DXF)
About Dunxin Financial Holdings Limited
Dunxin Financial Holdings Limited, together with its subsidiaries, engages in the microfinance lending business in the People's Republic of China. It provides consumer, commercial, collateral-backed, and enterprise loans to individuals; micro, small, and medium sized enterprises; and sole proprietors. Dunxin Financial Holdings Limited is headquartered in Wuhan, China.
| Metric | 2023 | 2022 | 2021 | 2020 | 2019 | 2018 | 2017 | 2016 | 2015 | 2014 | 2013 | 2012 | 2011 | 2010 | 2009 | 2008 |
|---|---|---|---|---|---|---|---|---|---|---|---|---|---|---|---|---|
| Revenue | -53.14M | 23.50M | -360.00K | 83.68M | 98.72M | 115.84M | 82.31M | 380.17M | 472.17M | 813.08M | 1.32B | 1.38B | 899.25M | 899.25M | 672.08M | 479.71M |
| Cost of Revenue | 0.00 | 0.00 | 0.00 | 0.00 | 0.00 | 0.00 | 0.00 | 431.54M | 741.17M | 864.46M | 932.64M | 922.33M | 589.23M | 589.23M | 438.77M | 313.52M |
| Gross Profit | -53.14M | 23.50M | -360.00K | 83.68M | 98.72M | 115.84M | 82.31M | -51.37M | -269.01M | -51.37M | 388.18M | 461.36M | 310.02M | 310.02M | 233.30M | 166.19M |
| Gross Profit Ratio | 100.00% | 100.00% | 100.00% | 100.00% | 100.00% | 100.00% | 100.00% | -13.51% | -56.97% | -6.32% | 29.39% | 33.34% | 34.48% | 34.48% | 34.71% | 34.64% |
| Research & Development | 0.00 | 0.00 | 0.00 | 0.00 | 0.00 | 0.00 | 0.00 | 0.00 | 0.00 | 0.00 | 0.00 | 0.00 | 0.00 | 0.00 | 0.00 | 0.00 |
| General & Administrative | 100.94M | 10.51M | 7.89M | 8.09M | 13.28M | 20.37M | 26.72M | 3.96M | 25.22M | 30.18M | 32.62M | 30.49M | 10.11M | 10.11M | 2.90M | 6.81M |
| Selling & Marketing | 0.00 | 514.00K | 293.00K | 170.00K | 1.70M | 1.79M | 3.14M | -166.16M | 269.45M | 166.16M | 238.86M | 214.13M | 12.00M | 12.00M | 8.74M | 15.93M |
| SG&A | 100.94M | 11.02M | 8.18M | 8.26M | 14.98M | 22.16M | 29.86M | 3.96M | 294.67M | 196.34M | 271.48M | 244.62M | 22.11M | 22.11M | 11.64M | 22.74M |
| Other Expenses | -2.29B | -37.50M | -110.28M | -76.06M | -66.81M | -87.00M | -32.54M | 0.00 | 0.00 | 0.00 | 0.00 | 0.00 | 0.00 | 0.00 | 0.00 | 0.00 |
| Operating Expenses | -2.19B | -26.48M | -102.10M | -67.80M | -51.83M | -64.84M | -2.69M | 3.96M | 294.67M | 196.34M | 271.48M | 244.62M | 22.11M | 22.11M | 11.64M | 22.74M |
| Cost & Expenses | -2.19B | -26.48M | -102.10M | -67.80M | -51.83M | -64.84M | -2.69M | 3.96M | 1.04B | 1.06B | 1.20B | 1.17B | 611.34M | 611.34M | 450.42M | 336.26M |
| Interest Income | 79.47M | 44.80M | 20.63M | 105.57M | 118.40M | 141.86M | 115.75M | 0.00 | 0.00 | 0.00 | 0.00 | 0.00 | 24.62M | 847.00K | 0.00 | 0.00 |
| Interest Expense | 132.61M | 21.30M | 21.37M | 21.91M | 19.85M | 26.45M | 38.14M | 0.00 | 0.00 | 0.00 | 0.00 | 0.00 | 0.00 | 0.00 | 0.00 | 0.00 |
| Depreciation & Amortization | 20.57M | 2.95M | 2.97M | 2.98M | 2.95M | 818.00K | 441.00K | -57.17M | 5.95M | 5.92M | 7.19M | 4.86M | 389.00K | 389.00K | 518.00K | 517.00K |
| EBITDA | 0.00 | 0.00 | 0.00 | 0.00 | 0.00 | 0.00 | 0.00 | 360.00K | -563.67M | -747.74K | 116.71M | 216.74M | 0.00 | 287.91M | 222.18M | 143.97M |
| EBITDA Ratio | 4,182.06% | -0.11% | 27,634.44% | 22.54% | 50.48% | 44.74% | 97.27% | 0.09% | -118.12% | -29.74% | 9.38% | 16.01% | 37.34% | 32.06% | 33.06% | 30.01% |
| Operating Income | -2.24B | -2.98M | -102.46M | 15.88M | 46.89M | 51.01M | 79.63M | 3.96M | 563.67M | 247.71M | 116.71M | 216.74M | 309.48M | 287.91M | 221.66M | 143.45M |
| Operating Income Ratio | 4,220.77% | -12.68% | 28,460.56% | 18.98% | 47.50% | 44.03% | 96.74% | 1.04% | 119.38% | 30.47% | 8.84% | 15.66% | 34.42% | 32.02% | 32.98% | 29.90% |
| Total Other Income/Expenses | 0.00 | -24.25M | 0.00 | 0.00 | 174.00K | 0.00 | 3.83M | -60.61M | 18.10M | 22.27M | 19.49M | 18.95M | 24.62M | 847.00K | 793.00K | 677.00K |
| Income Before Tax | -2.80B | -30.34M | -128.07M | 19.85M | 58.62M | 26.19M | 48.20M | -3.44M | -545.58M | -225.44M | 136.20M | 235.69M | 288.76M | 288.76M | 222.45M | 144.13M |
| Income Before Tax Ratio | 5,275.97% | -129.12% | 35,575.56% | 23.73% | 59.37% | 22.61% | 58.56% | -0.90% | -115.55% | -27.73% | 10.31% | 17.03% | 32.11% | 32.11% | 33.10% | 30.04% |
| Income Tax Expense | -560.78M | 21.30M | -25.61M | 3.97M | 11.72M | 18.03M | 14.64M | 333.93M | 54.76M | -54.76M | 39.03M | 60.24M | 36.41M | 36.41M | 28.11M | 18.11M |
| Net Income | -2.24B | -51.64M | -102.46M | 15.88M | 46.89M | 6.52M | 26.85M | -345.29M | -600.34M | -170.68M | 97.17M | 175.45M | 252.35M | 252.35M | 194.34M | 126.02M |
| Net Income Ratio | 4,220.77% | -219.74% | 28,460.56% | 18.98% | 47.50% | 5.63% | 32.62% | -90.83% | -127.15% | -20.99% | 7.36% | 12.68% | 28.06% | 28.06% | 28.92% | 26.27% |
| EPS | -510.34 | -24.71 | -49.07 | 9.60 | 22.49 | 3.13 | 48.00 | -727.83 | -1.27K | -359.76 | 201.60 | 364.80 | 595.20 | 595.20 | 465.60 | 302.40 |
| EPS Diluted | -510.34 | -24.71 | -49.07 | 9.60 | 22.49 | 3.13 | 48.00 | -727.83 | -1.27K | -359.76 | 201.60 | 364.80 | 595.20 | 595.20 | 465.60 | 302.40 |
| Weighted Avg Shares Out | 4.40M | 2.09M | 2.09M | 2.09M | 2.09M | 2.08M | 492.04K | 474.41K | 474.41K | 474.41K | 474.41K | 478.22K | 423.79K | 423.79K | 416.67K | 416.67K |
| Weighted Avg Shares Out (Dil) | 4.40M | 2.09M | 2.09M | 2.09M | 2.09M | 2.08M | 492.04K | 474.41K | 474.41K | 474.41K | 474.41K | 478.22K | 423.79K | 423.79K | 416.67K | 416.67K |

SIGNIFICANT DEMAND FOR COVID FREE CARIBBEAN ISLANDS REOPENING THIS SUMMER

The Case For Tencent Over Alibaba (NYSE:BABA)

Despegar.com Announces 1Q20 Financial Results
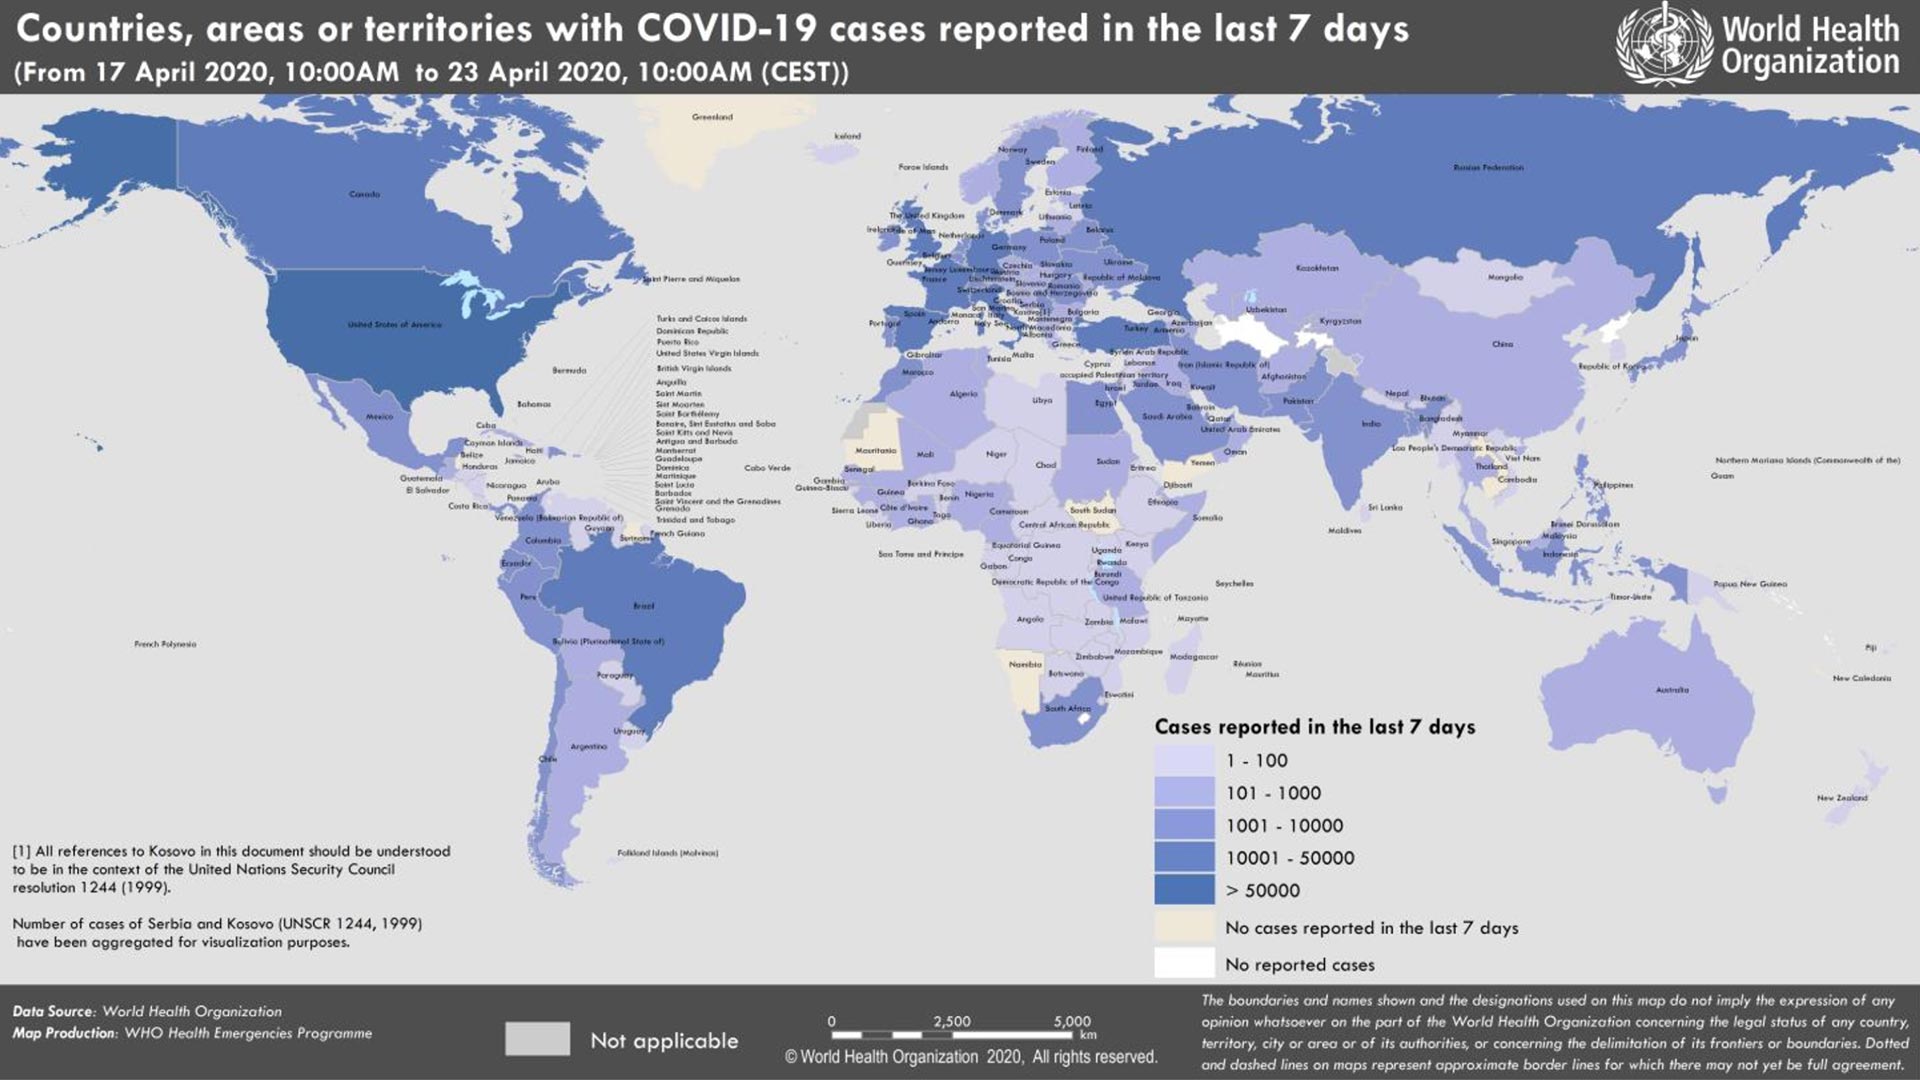
COVID-19 World Map: 2,544,792 Confirmed Cases; 207 Countries; 175,694 Deaths
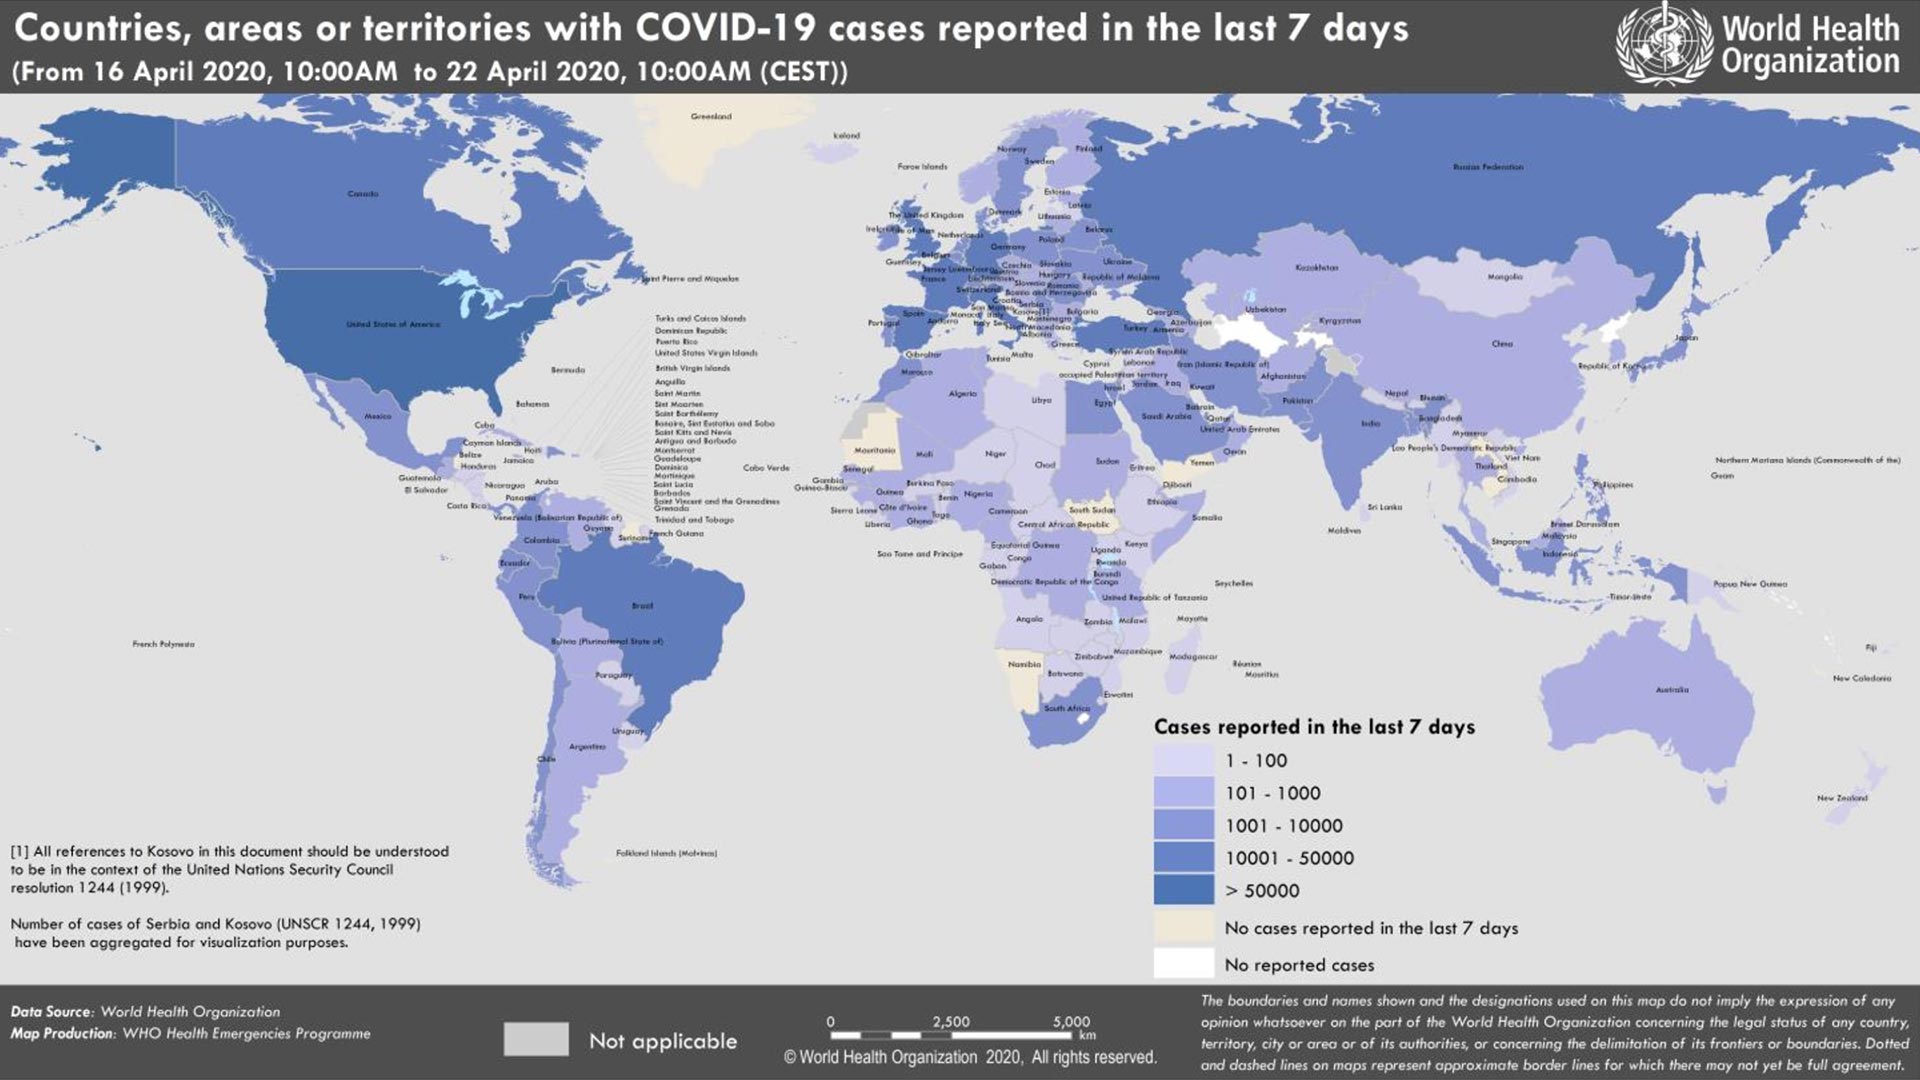
Coronavirus World Map: 2,471,136 Confirmed Cases; 207 Countries; 169,006 Deaths
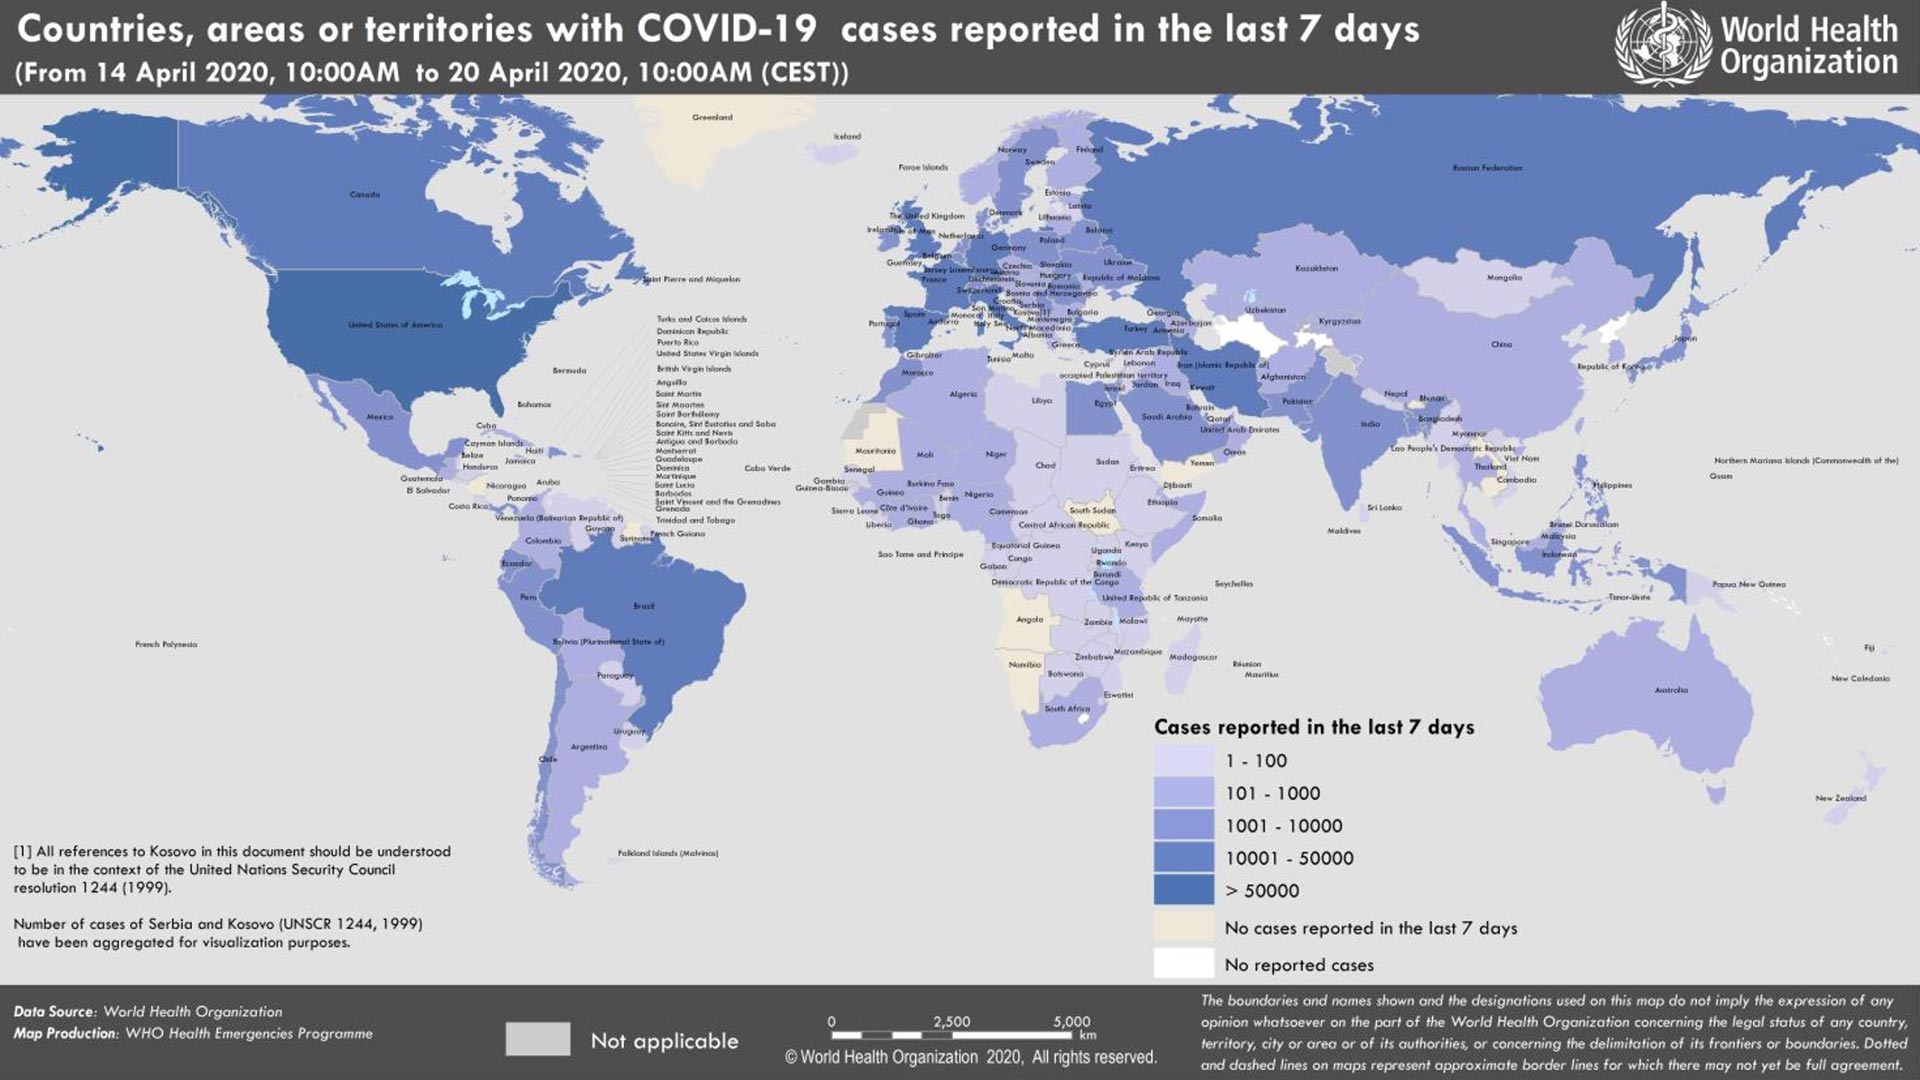
Coronavirus World Map: 2,314,621 Confirmed Cases; 207 Countries; 157,847 Deaths
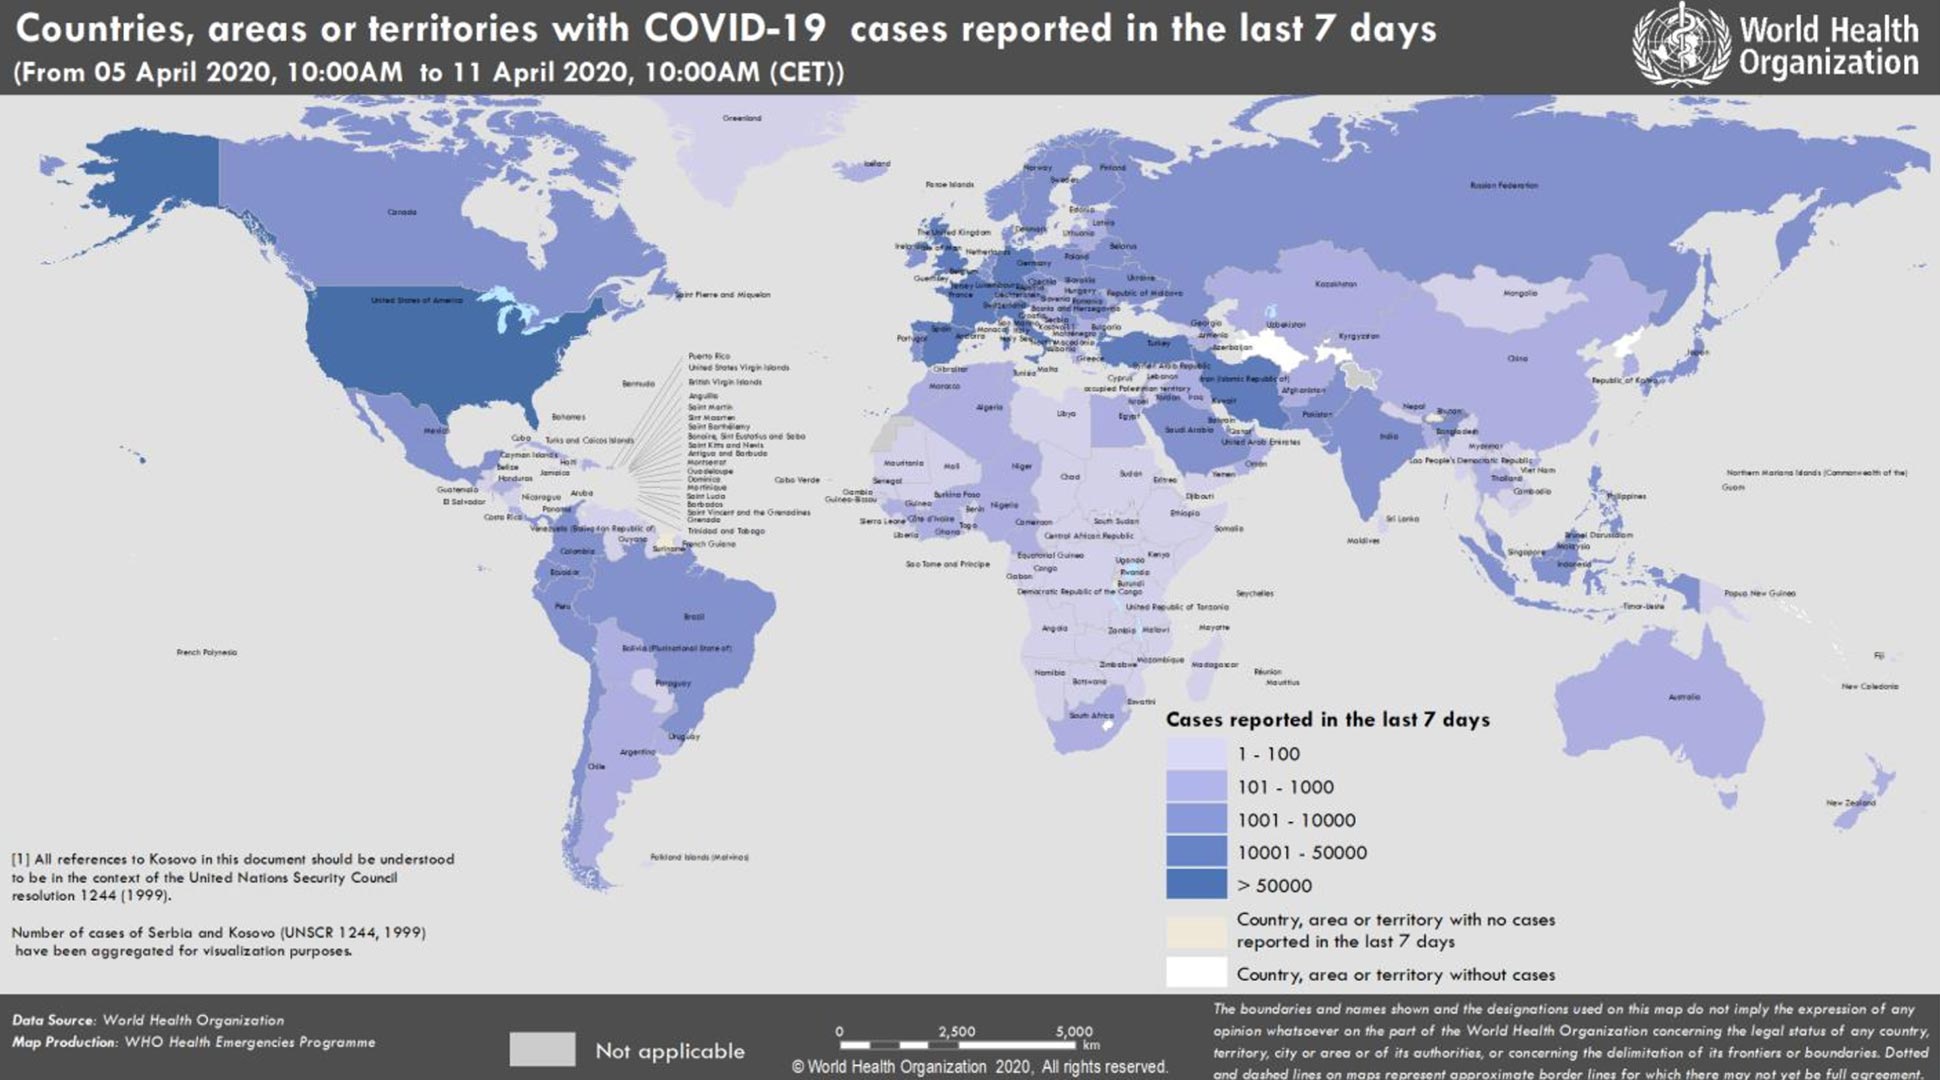
COVID-19 World Map: 1,610,909 Confirmed Cases; 207 Countries; 99,690 Deaths
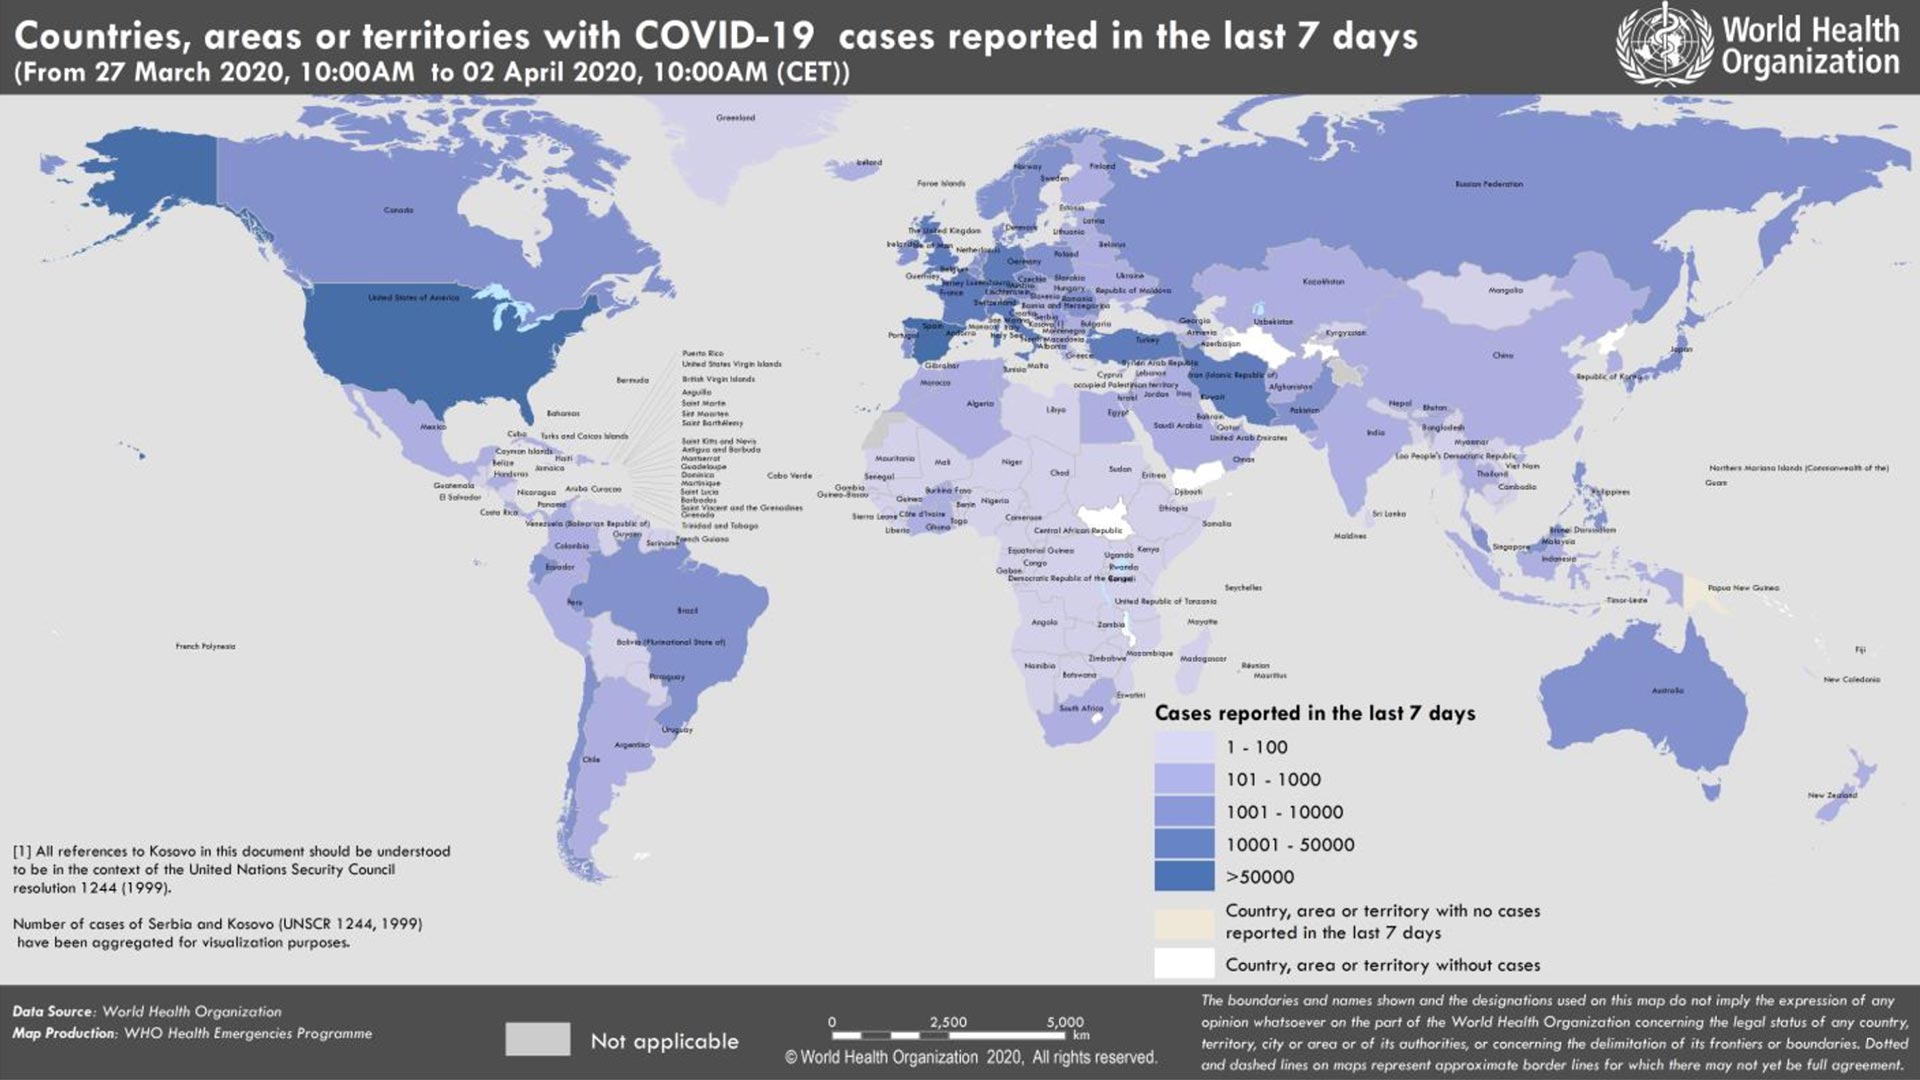
Coronavirus World Map: 896,450 Confirmed Cases; 201 Countries; 45,526 Deaths
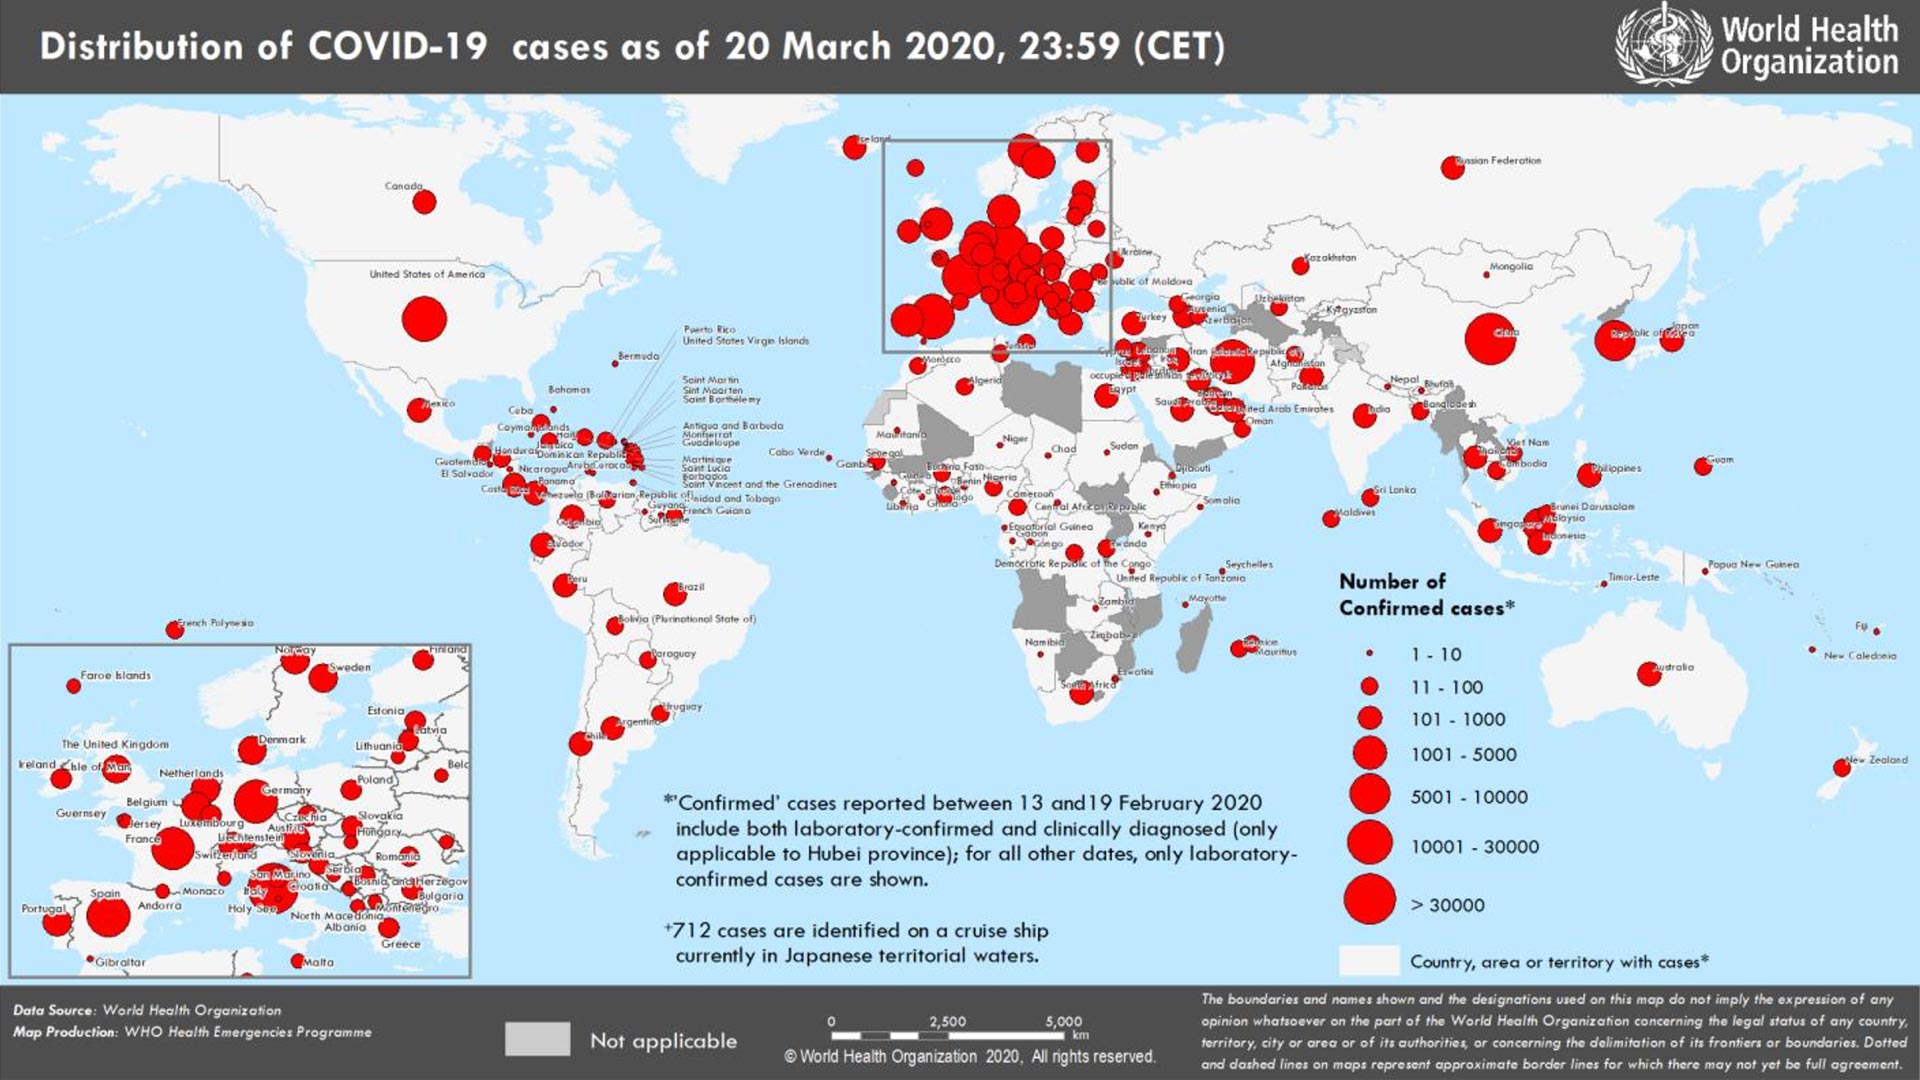
COVID-19 World Map: 266,073 Confirmed Cases; 179 Countries; 11,184 Deaths
Source: https://incomestatements.info
Category: Stock Reports

