See more : James Latham plc (LTHM.L) Income Statement Analysis – Financial Results
Complete financial analysis of EHang Holdings Limited (EH) income statement, including revenue, profit margins, EPS and key performance metrics. Get detailed insights into the financial performance of EHang Holdings Limited, a leading company in the Aerospace & Defense industry within the Industrials sector.
- Cheetah Oil & Gas, Ltd. (COHG) Income Statement Analysis – Financial Results
- IntelGenx Technologies Corp. (IGXT) Income Statement Analysis – Financial Results
- Art’s-Way Manufacturing Co., Inc. (ARTW) Income Statement Analysis – Financial Results
- Apollo Global Management, Inc. (APO-PA) Income Statement Analysis – Financial Results
- Hengan International Group Company Limited (1044.HK) Income Statement Analysis – Financial Results
EHang Holdings Limited (EH)
About EHang Holdings Limited
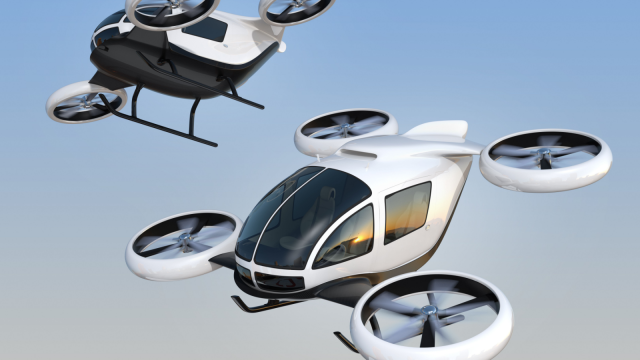
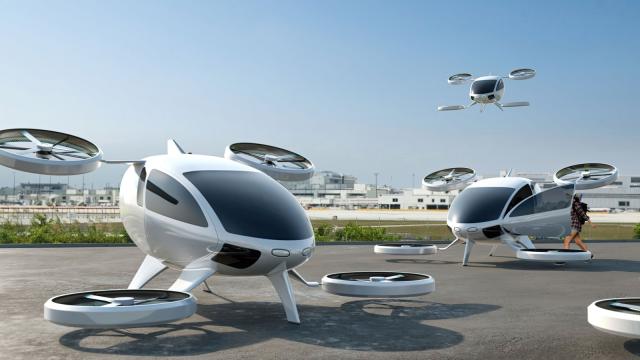
EHang Holdings Limited operates as an autonomous aerial vehicle (AAV) technology platform company in the People's Republic of China, East Asia, Europe, and internationally. It designs, develops, manufactures, sells, and operates AAVs, as well as their supporting systems and infrastructure for various industries and applications, including passenger transportation, logistics, smart city management, and aerial media solutions. The company was incorporated in 2014 and is headquartered in Guangzhou, the People's Republic of China.
| Metric | 2023 | 2022 | 2021 | 2020 | 2019 | 2018 | 2017 |
|---|---|---|---|---|---|---|---|
| Revenue | 117.43M | 44.32M | 56.81M | 180.09M | 121.81M | 66.49M | 31.70M |
| Cost of Revenue | 42.12M | 15.10M | 20.78M | 73.91M | 50.60M | 32.74M | 27.51M |
| Gross Profit | 75.31M | 29.22M | 36.03M | 106.18M | 71.22M | 33.75M | 4.18M |
| Gross Profit Ratio | 64.13% | 65.93% | 63.43% | 58.96% | 58.46% | 50.76% | 13.20% |
| Research & Development | 167.32M | 135.08M | 137.15M | 105.25M | 57.17M | 60.28M | 68.67M |
| General & Administrative | 150.09M | 151.07M | 187.39M | 61.61M | 36.95M | 35.94M | 35.39M |
| Selling & Marketing | 60.39M | 53.12M | 43.23M | 37.19M | 26.86M | 20.17M | 30.36M |
| SG&A | 210.48M | 204.18M | 230.62M | 98.80M | 63.80M | 56.11M | 65.74M |
| Other Expenses | -6.23M | -6.09M | -11.20M | -6.58M | -3.41M | -6.44M | 43.96M |
| Operating Expenses | 371.56M | 333.17M | 356.57M | 197.48M | 117.56M | 108.10M | 130.10M |
| Cost & Expenses | 413.68M | 348.27M | 377.34M | 271.39M | 168.16M | 140.84M | 157.61M |
| Interest Income | 8.48M | 4.67M | 5.14M | 3.80M | 883.00K | 1.06M | 174.00K |
| Interest Expense | 14.95M | 3.82M | 1.80M | 2.34M | 837.00K | 564.00K | 0.00 |
| Depreciation & Amortization | 21.36M | 20.89M | 7.77M | 6.19M | 5.67M | 5.60M | 4.44M |
| EBITDA | -264.26M | -304.74M | -312.76M | -85.10M | -40.67M | -68.75M | -121.48M |
| EBITDA Ratio | -225.05% | -731.41% | -547.21% | -46.20% | -33.46% | -111.50% | -244.03% |
| Operating Income | -296.25M | -303.95M | -320.54M | -91.30M | -46.35M | -74.35M | -125.92M |
| Operating Income Ratio | -252.29% | -685.85% | -564.25% | -50.69% | -38.05% | -111.82% | -397.28% |
| Total Other Income/Expenses | -5.88M | -25.50M | 7.05M | -775.00K | -821.00K | -6.04M | 44.53M |
| Income Before Tax | -302.14M | -329.45M | -313.49M | -92.07M | -47.17M | -80.23M | -81.39M |
| Income Before Tax Ratio | -257.30% | -743.39% | -551.84% | -51.12% | -38.72% | -120.66% | -256.79% |
| Income Tax Expense | 206.00K | 79.00K | 134.00K | 206.00K | 754.00K | 76.00K | 5.18M |
| Net Income | -301.70M | -329.53M | -313.62M | -92.28M | -47.92M | -79.11M | -87.43M |
| Net Income Ratio | -256.93% | -743.57% | -552.08% | -51.24% | -39.34% | -118.99% | -275.86% |
| EPS | -4.97 | -5.75 | -5.55 | -1.68 | -1.57 | -1.64 | -1.81 |
| EPS Diluted | -4.97 | -5.75 | -5.55 | -1.68 | -1.57 | -1.64 | -1.81 |
| Weighted Avg Shares Out | 60.75M | 57.35M | 56.49M | 54.78M | 30.57M | 48.31M | 48.31M |
| Weighted Avg Shares Out (Dil) | 60.75M | 57.35M | 56.49M | 54.78M | 30.57M | 48.31M | 48.31M |

3 Flying Car Stocks to Buy Before They Double in 2025

EHang: Investors Underestimate How Much The Chinese Government Wants This

The 3 Best Flying Car Stocks to Buy in June 2024

7 Growth Stocks to Buy and Forget for 30X Returns by 2030

EH216-S Pilotless eVTOL Completes Debut Flight in Saudi Arabia

3 Millionaire-Maker Flying Car Stocks to Buy in June 2024

EV Expeditioners: 3 Stocks Leading the Charge to Uncharted Territories

3 Flying Car Stocks to Turn $5,000 Into $1 Million: June 2024

7 High-Beta Growth Stocks to Buy for 20-Bagger Returns

EVs vs. eVTOLs: 3 Stocks to Buy for the Future of Transportation
Source: https://incomestatements.info
Category: Stock Reports
