See more : Daphne International Holdings Limited (DPNEY) Income Statement Analysis – Financial Results
Complete financial analysis of Evoke plc (EIHDF) income statement, including revenue, profit margins, EPS and key performance metrics. Get detailed insights into the financial performance of Evoke plc, a leading company in the Gambling, Resorts & Casinos industry within the Consumer Cyclical sector.
- Yoshimura Food Holdings K.K. (2884.T) Income Statement Analysis – Financial Results
- Hyundai Green Food (453340.KS) Income Statement Analysis – Financial Results
- Aldebaran Resources Inc. (ALDE.V) Income Statement Analysis – Financial Results
- Tonix Pharmaceuticals Holding Corp. (TNXP) Income Statement Analysis – Financial Results
- ZheJiang Haers Vacuum Containers Co.,Ltd. (002615.SZ) Income Statement Analysis – Financial Results
Evoke plc (EIHDF)
About Evoke plc
Evoke plc, together with its subsidiaries, provides online betting and gaming products and solutions in the United Kingdom, Ireland Italy, Spain, and internationally. The company operates through Retail, UK Online, and International segments. It engages in the operation of gaming machines; and sports betting, casino, poker, and other gaming products, as well as offers telephone betting services. The company owns and operates its business through William Hill, 888casino, 888poker, 888sport, Mr Green, William Hill Vegas, SI Casino, and SI Sportsbook brands. The company was formerly known as 888 Holdings plc and changed its name to Evoke plc in May 2024. Evoke plc was founded in 1997 and is headquartered in Gibraltar, Gibraltar.
| Metric | 2023 | 2022 | 2021 | 2020 | 2019 | 2018 | 2017 | 2016 | 2015 | 2014 | 2013 | 2012 | 2011 | 2010 | 2009 | 2008 | 2007 | 2006 | 2005 | 2004 | 2003 | 2002 |
|---|---|---|---|---|---|---|---|---|---|---|---|---|---|---|---|---|---|---|---|---|---|---|
| Revenue | 1.71B | 1.24B | 589.86M | 512.10M | 427.33M | 426.04M | 400.92M | 422.11M | 311.91M | 292.14M | 242.88M | 232.55M | 213.29M | 169.83M | 152.57M | 179.29M | 107.60M | 80.13M | 157.51M | 92.75M | 38.44M | 56.30M |
| Cost of Revenue | 570.00M | 440.50M | 117.36M | 99.13M | 67.19M | 0.00 | 0.00 | 0.00 | 0.00 | 0.00 | 0.00 | 0.00 | 0.00 | 0.00 | 0.00 | 0.00 | 0.00 | 0.00 | 0.00 | 0.00 | 0.00 | 0.00 |
| Gross Profit | 1.14B | 798.30M | 472.50M | 412.97M | 360.14M | 426.04M | 400.92M | 422.11M | 311.91M | 292.14M | 242.88M | 232.55M | 213.29M | 169.83M | 152.57M | 179.29M | 107.60M | 80.13M | 157.51M | 92.75M | 38.44M | 56.30M |
| Gross Profit Ratio | 66.68% | 64.44% | 80.10% | 80.64% | 84.28% | 100.00% | 100.00% | 100.00% | 100.00% | 100.00% | 100.00% | 100.00% | 100.00% | 100.00% | 100.00% | 100.00% | 100.00% | 100.00% | 100.00% | 100.00% | 100.00% | 100.00% |
| Research & Development | 0.00 | 0.00 | 0.00 | 0.00 | 25.63M | 25.85M | 26.19M | 27.80M | 24.84M | 26.15M | 18.62M | 16.83M | 19.26M | 14.49M | 14.94M | 18.70M | 11.85M | 9.89M | 6.58M | 3.58M | 1.78M | 1.46M |
| General & Administrative | 0.00 | 0.00 | 0.00 | 0.00 | 29.74M | 28.53M | 27.90M | 29.34M | 21.94M | 22.55M | 19.41M | 18.32M | 33.54M | 0.00 | 0.00 | 0.00 | -35.56M | -22.77M | 11.68M | -26.54M | 0.00 | 0.00 |
| Selling & Marketing | 237.60M | 257.80M | 227.10M | 173.98M | 123.40M | 122.15M | 120.25M | 137.95M | 93.76M | 85.96M | 84.84M | 81.19M | 65.86M | 59.29M | 41.64M | 54.73M | 35.75M | 26.05M | 58.12M | 33.62M | 0.00 | 0.00 |
| SG&A | 237.60M | 257.80M | 227.10M | 173.98M | 153.15M | 150.68M | 148.14M | 167.29M | 115.69M | 108.51M | 104.25M | 99.50M | 99.40M | 59.29M | 41.64M | 54.73M | 189.09K | 3.28M | 69.80M | 7.08M | 0.00 | 0.00 |
| Other Expenses | 870.30M | 0.00 | 0.00 | 0.00 | 0.00 | 0.00 | 0.00 | 0.00 | 0.00 | 100.00K | -500.00K | 2.00M | 0.00 | 0.00 | 0.00 | 0.00 | -1.12M | -4.74M | 0.00 | 0.00 | 0.00 | 0.00 |
| Operating Expenses | 1.11B | 706.30M | 390.18M | 331.44M | 385.76M | 364.41M | 346.97M | 372.26M | 278.50M | 240.74M | 208.79M | 209.71M | 184.61M | 160.74M | 133.98M | 151.96M | 93.03M | 83.05M | 128.79M | 70.43M | 31.95M | 43.70M |
| Cost & Expenses | 1.68B | 1.15B | 507.54M | 430.58M | 385.76M | 364.41M | 346.97M | 372.26M | 278.50M | 240.74M | 208.79M | 209.71M | 184.61M | 160.74M | 133.98M | 151.96M | 93.03M | 83.05M | 128.79M | 70.43M | 31.95M | 43.70M |
| Interest Income | 4.60M | 800.00K | 74.09K | 73.38K | 381.34K | 472.85K | 443.98K | 324.20K | 202.50K | 192.74K | 181.93K | 247.52K | 150.14K | 127.82K | 390.98K | 2.00M | 2.50M | 2.49M | 427.15K | 138.68K | 13.44K | 8.07K |
| Interest Expense | 182.70M | 77.90M | 4.30M | 1.98M | 2.21M | 0.00 | 0.00 | 0.00 | 135.00K | 0.00 | 0.00 | 680.69K | 2.38M | 739.53K | 250.98K | 0.00 | 0.00 | 0.00 | 0.00 | 0.00 | 0.00 | 0.00 |
| Depreciation & Amortization | 228.30M | 120.30M | 26.40M | 24.65M | 16.80M | 16.00M | 14.28M | 15.40M | 12.55M | 12.21M | 8.43M | 9.16M | 8.40M | 7.95M | 5.26M | 5.01M | 2.90M | 1.94M | 1.58M | 1.27M | 728.00K | 424.66K |
| EBITDA | 289.70M | 100.38M | 109.29M | 46.23M | 63.07M | 101.66M | 68.23M | 67.68M | 44.55M | 65.34M | 42.51M | 35.09M | 32.06M | 16.98M | 22.56M | 32.33M | 22.05M | 8.78M | 30.30M | 23.73M | 7.22M | 13.03M |
| EBITDA Ratio | 16.93% | 9.69% | 18.53% | 9.27% | 14.76% | 14.24% | 26.39% | 15.02% | 14.28% | 22.37% | 18.28% | 13.44% | 15.03% | 10.00% | 14.78% | 18.06% | 20.49% | 10.95% | 19.24% | 25.58% | 18.77% | 23.15% |
| Operating Income | 33.00M | -4.80M | 64.46M | 24.07M | 39.81M | 78.57M | 16.35M | 49.12M | 27.54M | 51.40M | 34.08M | 22.83M | 9.39M | 7.44M | 16.91M | 25.48M | 16.65M | 4.33M | 28.72M | 22.33M | 6.50M | 12.60M |
| Operating Income Ratio | 1.93% | -0.39% | 10.93% | 4.70% | 9.32% | 18.44% | 4.08% | 11.64% | 8.83% | 17.59% | 14.03% | 9.82% | 4.40% | 4.38% | 11.08% | 14.21% | 15.48% | 5.40% | 18.23% | 24.07% | 16.91% | 22.38% |
| Total Other Income/Expenses | -154.30M | -110.90M | 16.71M | -4.48M | -5.26M | -2.94M | -58.99M | -1.13M | -5.60M | -7.77M | -1.82M | 2.41M | -5.67M | -599.54K | 139.99K | 2.00M | 2.50M | 2.49M | 427.15K | 138.68K | 13.44K | 8.07K |
| Income Before Tax | -121.30M | -115.70M | 60.24M | 19.59M | 34.55M | 85.66M | 13.91M | 47.98M | 21.94M | 43.62M | 32.26M | 25.25M | 3.77M | 6.84M | 17.05M | 27.48M | 19.15M | 6.82M | 29.15M | 22.46M | 6.51M | 12.61M |
| Income Before Tax Ratio | -7.09% | -9.34% | 10.21% | 3.83% | 8.08% | 20.11% | 3.47% | 11.37% | 7.03% | 14.93% | 13.28% | 10.86% | 1.77% | 4.03% | 11.17% | 15.33% | 17.80% | 8.51% | 18.50% | 24.22% | 16.95% | 22.40% |
| Income Tax Expense | -64.90M | 4.90M | 9.19M | 11.30M | 2.82M | 10.95M | 4.59M | 6.24M | 2.02M | 7.07M | 1.94M | 3.34M | 2.52M | 1.75M | 1.69M | 2.09M | 1.61M | 1.59M | 1.24M | 1.04M | 397.60K | 2.76M |
| Net Income | -56.40M | -120.50M | 49.90M | 8.29M | 31.73M | 74.71M | 9.32M | 41.74M | 19.91M | 36.56M | 30.32M | 21.91M | 1.22M | 5.09M | 15.36M | 25.39M | 17.26M | 38.03M | 27.90M | 21.43M | 6.12M | 9.85M |
| Net Income Ratio | -3.30% | -9.73% | 8.46% | 1.62% | 7.42% | 17.54% | 2.33% | 9.89% | 6.38% | 12.51% | 12.48% | 9.42% | 0.57% | 3.00% | 10.07% | 14.16% | 16.04% | 47.45% | 17.72% | 23.10% | 15.91% | 17.50% |
| EPS | -0.13 | -0.28 | 0.14 | 0.02 | 0.09 | 0.21 | 0.03 | 0.12 | 0.06 | 0.10 | 0.09 | 0.06 | 0.00 | 0.01 | 0.04 | 0.07 | 0.05 | 0.11 | 0.08 | 0.06 | 0.01 | 0.02 |
| EPS Diluted | -0.13 | -0.28 | 0.14 | 0.02 | 0.09 | 0.20 | 0.03 | 0.11 | 0.06 | 0.10 | 0.08 | 0.06 | 0.00 | 0.01 | 0.04 | 0.07 | 0.05 | 0.11 | 0.08 | 0.06 | 0.01 | 0.02 |
| Weighted Avg Shares Out | 447.62M | 426.54M | 371.38M | 368.59M | 367.17M | 361.12M | 359.26M | 358.15M | 356.13M | 353.52M | 350.91M | 348.88M | 346.39M | 345.71M | 345.18M | 341.52M | 338.84M | 337.22M | 337.10M | 337.10M | 337.10M | 337.10M |
| Weighted Avg Shares Out (Dil) | 448.17M | 432.77M | 377.70M | 376.05M | 369.30M | 366.90M | 368.15M | 365.94M | 359.71M | 356.74M | 356.35M | 351.55M | 349.98M | 345.71M | 349.14M | 347.32M | 346.07M | 337.22M | 337.10M | 337.10M | 337.10M | 337.10M |
888 Holdings sells assets to Hard Rock in US exit

William Hill owner 888 Holdings' new top team set to update strategy - was 2023 just a dream?
888 Holdings mulls sale of US business

British gambling group 888 explores selling, exiting some US operations

Here's why 888 Holdings share price has a 30% downside
888 Holdings tipped by Berenberg with a 190p price target
888 Holdings: A Below The Radar, Sports Betting Entry

Flutter, Entain and 888 singing in the rain as UK gambling spend bounces back

888 Holdings plc (EIHDF) Q2 2023 Earnings Call Transcript
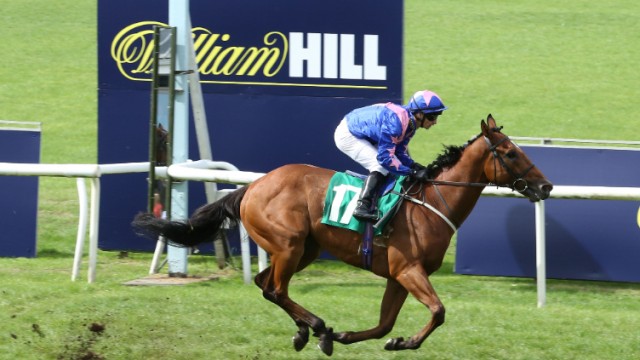
888 Holdings names Per Widerstrom as new chief executive
Source: https://incomestatements.info
Category: Stock Reports
