See more : National Beverage Corp. (0K50.L) Income Statement Analysis – Financial Results
Complete financial analysis of EverGen Infrastructure Corp. (EVGIF) income statement, including revenue, profit margins, EPS and key performance metrics. Get detailed insights into the financial performance of EverGen Infrastructure Corp., a leading company in the Regulated Gas industry within the Utilities sector.
- AV TECH Corporation (8072.TW) Income Statement Analysis – Financial Results
- Aroundtown SA (AT1.DE) Income Statement Analysis – Financial Results
- Adhbhut Infrastructure Limited (ADHBHUTIN.BO) Income Statement Analysis – Financial Results
- LuxUrban Hotels Inc. 13.00% Series A Cumulative Redeemable Preferred Stock (LUXHP) Income Statement Analysis – Financial Results
- Unlimited Travel Group UTG AB (publ) (UTG.ST) Income Statement Analysis – Financial Results
EverGen Infrastructure Corp. (EVGIF)
About EverGen Infrastructure Corp.
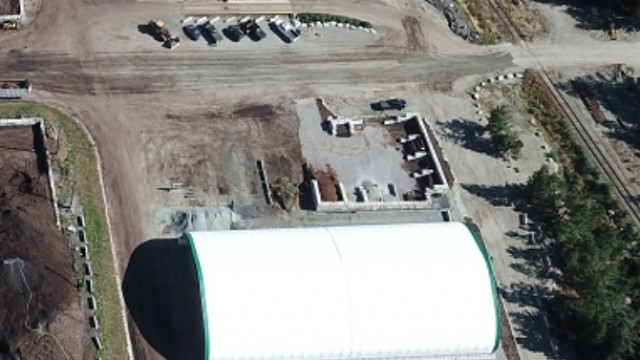
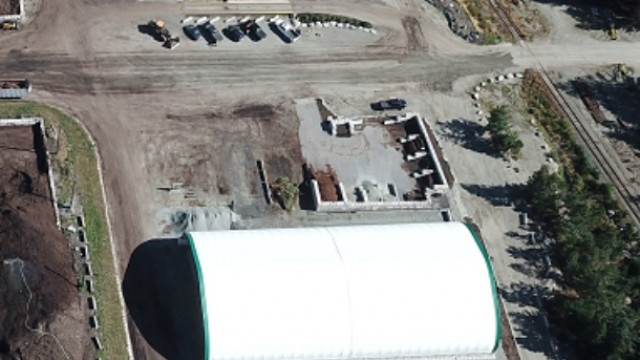
EverGen Infrastructure Corp. acquires, develops, builds, owns, and operates a portfolio of renewable natural gas, waste to energy, and related infrastructure projects in British Columbia. It operates Fraser Valley Biogas project, which is an anaerobic digestion facility that generates renewable natural gas and renewable fertilizers; the Zero Net Waste Abbotsford project; the Sea To Sky Soils project that processes organics to produce stable compost; the GrowTEC project; and the Radius project. The company was incorporated in 2020 and is headquartered in Vancouver, Canada.
| Metric | 2023 | 2022 | 2021 | 2020 |
|---|---|---|---|---|
| Revenue | 8.44M | 7.46M | 9.56M | 0.00 |
| Cost of Revenue | 9.91M | 9.95M | 2.78M | 0.00 |
| Gross Profit | -1.46M | -2.49M | 6.79M | 0.00 |
| Gross Profit Ratio | -17.34% | -33.42% | 70.97% | 0.00% |
| Research & Development | 0.00 | 0.00 | 0.00 | 0.00 |
| General & Administrative | 5.09M | 6.65M | 5.16M | 492.00K |
| Selling & Marketing | 0.00 | 0.00 | 0.00 | 1.29M |
| SG&A | 5.09M | 6.65M | 5.16M | 1.78M |
| Other Expenses | -6.56M | 286.00K | 1.71M | 0.00 |
| Operating Expenses | -1.46M | 14.58M | 10.37M | 1.78M |
| Cost & Expenses | 13.79M | 14.58M | 13.15M | 1.78M |
| Interest Income | 0.00 | 16.00K | 0.00 | 0.00 |
| Interest Expense | 918.00K | 612.00K | 392.00K | 0.00 |
| Depreciation & Amortization | 3.63M | 3.19M | 2.76M | 2.67M |
| EBITDA | -1.87M | -1.05M | 770.00K | 0.00 |
| EBITDA Ratio | -22.13% | -50.56% | 8.56% | 0.00% |
| Operating Income | -5.35M | -6.96M | -1.94M | -1.78M |
| Operating Income Ratio | -63.35% | -93.28% | -20.29% | 0.00% |
| Total Other Income/Expenses | -1.07M | 260.00K | -900.00K | -741.00K |
| Income Before Tax | -6.42M | -4.85M | -2.38M | -2.52M |
| Income Before Tax Ratio | -76.05% | -65.02% | -24.91% | 0.00% |
| Income Tax Expense | -1.68M | -740.00K | -429.00K | -288.00K |
| Net Income | -4.42M | -4.10M | -1.95M | -2.23M |
| Net Income Ratio | -52.38% | -54.95% | -20.42% | 0.00% |
| EPS | -0.32 | -0.30 | -0.15 | -0.16 |
| EPS Diluted | -0.32 | -0.30 | -0.15 | -0.16 |
| Weighted Avg Shares Out | 13.85M | 13.59M | 13.37M | 13.83M |
| Weighted Avg Shares Out (Dil) | 13.85M | 13.59M | 13.37M | 13.83M |

EverGen Infrastructure acquires Ontario natural gas foothold with 50% stake in Northeast Renewable's Project Radius

EverGen Infrastructure Corp. Announces Dates for 2022 First Quarter Financial Results & Conference Call

EverGen Infrastructure reports financial results for 2021 showing growth in revenue and adjusted EBITDA in a transformational year

EverGen Infrastructure Corp. Announces Dates for 2021 Fourth Quarter and Year End Financial Results & Corporate Update Conference Call

EverGen Infrastructure working to 'close the gap' in North America's renewable energy infrastructure

EverGen Infrastructure says its common shares will begin trading on the OTCQB Venture Market as of the market open today
Source: https://incomestatements.info
Category: Stock Reports
