See more : Três Tentos Agroindustrial S/A (TTEN3.SA) Income Statement Analysis – Financial Results
Complete financial analysis of Evonik Industries AG (EVKIF) income statement, including revenue, profit margins, EPS and key performance metrics. Get detailed insights into the financial performance of Evonik Industries AG, a leading company in the Chemicals – Specialty industry within the Basic Materials sector.
- Hypercharge Networks Corp. (HC.V) Income Statement Analysis – Financial Results
- Anthemis Digital Acquisitions I Corp (ADALU) Income Statement Analysis – Financial Results
- Axactor ASA (ACR.OL) Income Statement Analysis – Financial Results
- Stark Technology, Inc. (2480.TW) Income Statement Analysis – Financial Results
- Huhtamäki Oyj (HUH1V.HE) Income Statement Analysis – Financial Results
Evonik Industries AG (EVKIF)
About Evonik Industries AG
Evonik Industries AG engages in the specialty chemicals business. It operates through Specialty Additives, Nutrition & Care, Smart Materials, Performance Materials, and Technology & Infrastructure segments. The Specialty Additives segment provides polyurethane additives, organically modified silicones, isophorones, epoxy curing agents, oil additives, fumed silicas, matting agents, TAA and TAA derivatives, and acetylenic diol-based surfactants for consumer goods and specialized industrial applications. The Nutrition & Care segment offers amphoteric surfactants, ceramides, phytosphingosines, oleochemicals, quaternary derivatives, amino acids and amino acid derivatives, synthesis products, pharmaceutical polymers, and DL-methionine for use in consumer goods, animal nutrition, and healthcare products. The Smart Materials segment provides hydrogen peroxide, peracetic acid, activated nickel catalysts, precious metal powder catalysts, oil and fat hydrogenation catalysts, amorphous polyalphaolefins, polybutadienes, polyester resins, thermoplastic and reactive methacrylate resins, PEEK, polyamide 12, organosilanes, chlorosilanes, fumed silicas, fumed metal oxides, and precipitated silicas for the automotive, paints, coatings, adhesives, construction, and various other sectors. The Performance Materials segment produces polymer materials and intermediates, including butene-1, DINP, isononanol, cyanuric chloride, alkoxides, and superabsorbent for rubber, plastics, and automotive industries. The Technology & Infrastructure segment provides site management, utilities and waste management, technical, process technology, engineering, and logistics services. It operates in the Asia-Pacific, Europe, the Middle East, Africa, Central and South America, and North America. The company was founded in 1873 and is headquartered in Essen, Germany. Evonik Industries AG is a subsidiary of RAG-Stiftung.
| Metric | 2023 | 2022 | 2021 | 2020 | 2019 | 2018 | 2017 | 2016 | 2015 | 2014 | 2013 | 2012 | 2011 | 2010 | 2009 | 2008 | 2007 | 2006 |
|---|---|---|---|---|---|---|---|---|---|---|---|---|---|---|---|---|---|---|
| Revenue | 15.27B | 18.49B | 14.96B | 12.20B | 13.11B | 15.02B | 14.42B | 12.73B | 13.51B | 12.92B | 12.87B | 13.63B | 14.54B | 13.30B | 13.08B | 15.87B | 14.43B | 14.13B |
| Cost of Revenue | 12.57B | 14.26B | 10.93B | 8.83B | 9.41B | 10.40B | 9.94B | 8.53B | 9.10B | 9.31B | 9.31B | 9.70B | 10.25B | 9.44B | 9.86B | 9.17B | 7.84B | 7.63B |
| Gross Profit | 2.70B | 4.23B | 4.03B | 3.37B | 3.70B | 4.63B | 4.48B | 4.20B | 4.41B | 3.61B | 3.56B | 3.93B | 4.29B | 3.86B | 3.21B | 6.71B | 6.59B | 6.50B |
| Gross Profit Ratio | 17.69% | 22.89% | 26.95% | 27.59% | 28.19% | 30.78% | 31.08% | 32.97% | 32.66% | 27.94% | 27.68% | 28.83% | 29.53% | 29.02% | 24.58% | 42.24% | 45.65% | 46.00% |
| Research & Development | 443.00M | 460.00M | 464.00M | 433.00M | 428.00M | 459.00M | 458.00M | 438.00M | 434.00M | 413.00M | 394.00M | 393.00M | 365.00M | 338.00M | 300.00M | 0.00 | 0.00 | 0.00 |
| General & Administrative | 497.00M | 554.00M | 546.00M | 502.00M | 568.00M | 656.00M | 732.00M | 686.00M | 693.00M | 601.00M | 631.00M | 647.00M | 663.00M | 624.00M | 638.00M | 0.00 | 421.00M | 393.00M |
| Selling & Marketing | 1.84B | 2.04B | 1.72B | 1.50B | 1.51B | 1.75B | 1.70B | 1.52B | 1.45B | 1.29B | 1.29B | 1.24B | 1.24B | 1.17B | 1.04B | 0.00 | 600.00M | 569.00M |
| SG&A | 2.33B | 2.59B | 2.26B | 2.00B | 2.08B | 2.41B | 2.43B | 2.20B | 2.14B | 1.89B | 1.93B | 1.89B | 1.91B | 1.80B | 1.68B | 0.00 | 1.02B | 962.00M |
| Other Expenses | -76.00M | -30.00M | -26.00M | -43.00M | 71.00M | 59.00M | 63.00M | 56.00M | 55.00M | 55.00M | 66.00M | 93.00M | 0.00 | 0.00 | 0.00 | 0.00 | 0.00 | 0.00 |
| Operating Expenses | 2.70B | 2.96B | 2.80B | 2.49B | 2.57B | 3.06B | 3.14B | 2.88B | 2.77B | 2.45B | 2.33B | 1.98B | 2.46B | 2.37B | 2.40B | 5.89B | 5.75B | 6.02B |
| Cost & Expenses | 15.27B | 17.22B | 13.73B | 11.32B | 11.98B | 13.46B | 13.08B | 11.42B | 11.87B | 11.76B | 11.64B | 11.68B | 12.70B | 11.81B | 12.26B | 15.06B | 13.60B | 13.65B |
| Interest Income | 41.00M | 144.00M | 64.00M | 48.00M | 104.00M | 49.00M | 73.00M | 80.00M | 46.00M | 71.00M | 35.00M | 35.00M | 50.00M | 14.00M | 39.00M | 76.00M | 33.00M | 30.00M |
| Interest Expense | 108.00M | 121.00M | 129.00M | 171.00M | 221.00M | 210.00M | 242.00M | 229.00M | 245.00M | 289.00M | 290.00M | 392.00M | 431.00M | 204.00M | 522.00M | 606.00M | 286.00M | 262.00M |
| Depreciation & Amortization | 1.84B | 1.10B | 1.02B | 997.00M | 947.00M | 837.00M | 829.00M | 707.00M | 764.00M | 656.00M | 630.00M | 800.00M | 785.00M | 799.00M | 913.00M | 1.12B | 1.12B | 1.33B |
| EBITDA | 1.73B | 2.61B | 2.29B | 1.87B | 2.16B | 1.88B | 2.19B | 2.10B | 2.45B | 1.79B | 1.74B | 2.66B | 2.76B | 2.23B | 1.85B | 2.09B | 1.83B | 1.79B |
| EBITDA Ratio | 11.36% | 16.19% | 15.47% | 15.61% | 17.32% | 16.95% | 16.18% | 17.33% | 18.38% | 15.12% | 15.46% | 21.66% | 18.98% | 16.56% | 14.13% | 13.44% | 12.66% | 11.49% |
| Operating Income | -30.00M | 1.43B | 1.24B | 886.00M | 1.29B | 1.67B | 1.41B | 1.46B | 1.72B | 1.30B | 1.36B | 2.15B | 1.97B | 1.40B | 934.00M | 1.02B | 708.00M | 192.00M |
| Operating Income Ratio | -0.20% | 7.71% | 8.30% | 7.26% | 9.81% | 11.12% | 9.78% | 11.46% | 12.73% | 10.04% | 10.56% | 15.79% | 13.58% | 10.56% | 7.14% | 6.39% | 4.91% | 1.36% |
| Total Other Income/Expenses | -321.00M | -375.00M | -264.00M | -204.00M | -218.00M | 74.00M | -249.00M | -236.00M | -197.00M | -314.00M | -405.00M | -348.00M | -340.00M | -429.00M | -527.00M | -653.00M | -416.00M | 0.00 |
| Income Before Tax | -351.00M | 923.00M | 1.09B | 684.00M | 954.00M | 1.20B | 1.03B | 1.12B | 1.44B | 842.00M | 836.00M | 1.61B | 1.54B | 975.00M | 412.00M | 368.00M | 527.00M | 192.00M |
| Income Before Tax Ratio | -2.30% | 4.99% | 7.26% | 5.61% | 7.28% | 8.00% | 7.12% | 8.83% | 10.67% | 6.52% | 6.49% | 11.83% | 10.61% | 7.33% | 3.15% | 2.32% | 3.65% | 1.36% |
| Income Tax Expense | 101.00M | 369.00M | 316.00M | 181.00M | 180.00M | 250.00M | 293.00M | 362.00M | 422.00M | 252.00M | 220.00M | 460.00M | 451.00M | 175.00M | 94.00M | 130.00M | 158.00M | 33.00M |
| Net Income | -465.00M | 540.00M | 746.00M | 465.00M | 2.11B | 932.00M | 717.00M | 844.00M | 991.00M | 568.00M | 2.05B | 1.16B | 1.01B | 734.00M | 240.00M | 285.00M | 876.00M | 1.05B |
| Net Income Ratio | -3.05% | 2.92% | 4.99% | 3.81% | 16.07% | 6.20% | 4.97% | 6.63% | 7.34% | 4.40% | 15.95% | 8.54% | 6.95% | 5.52% | 1.84% | 1.80% | 6.07% | 7.41% |
| EPS | -1.00 | 1.16 | 1.60 | 1.06 | 1.77 | 2.00 | 1.53 | 1.81 | 2.13 | 1.22 | 4.41 | 2.50 | 2.17 | 1.71 | 0.52 | 0.60 | 1.88 | 2.24 |
| EPS Diluted | -1.00 | 1.16 | 1.60 | 1.06 | 1.77 | 2.00 | 1.53 | 1.81 | 2.13 | 1.22 | 4.41 | 2.50 | 2.17 | 1.71 | 0.52 | 0.60 | 1.88 | 2.24 |
| Weighted Avg Shares Out | 466.00M | 466.00M | 466.00M | 466.00M | 466.00M | 466.00M | 466.00M | 466.00M | 466.00M | 466.00M | 466.00M | 466.00M | 466.00M | 466.00M | 466.00M | 466.00M | 466.00M | 466.00M |
| Weighted Avg Shares Out (Dil) | 466.00M | 466.00M | 466.00M | 466.00M | 466.00M | 466.00M | 466.00M | 466.00M | 466.00M | 466.00M | 466.00M | 466.00M | 466.00M | 466.00M | 466.00M | 466.00M | 466.00M | 466.00M |
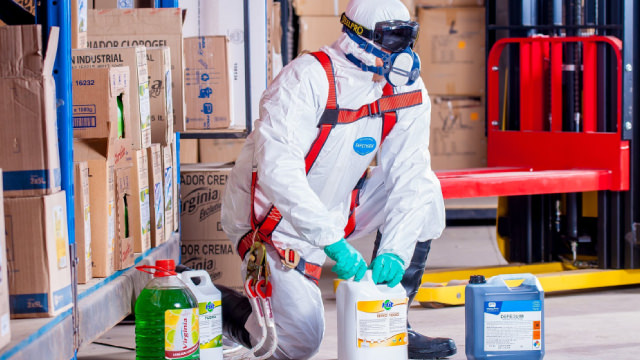
Evonik: A Good Company, Upside Less Clear Than Before

Evonik Industries AG (EVKIF) Q3 2024 Earnings Call Transcript
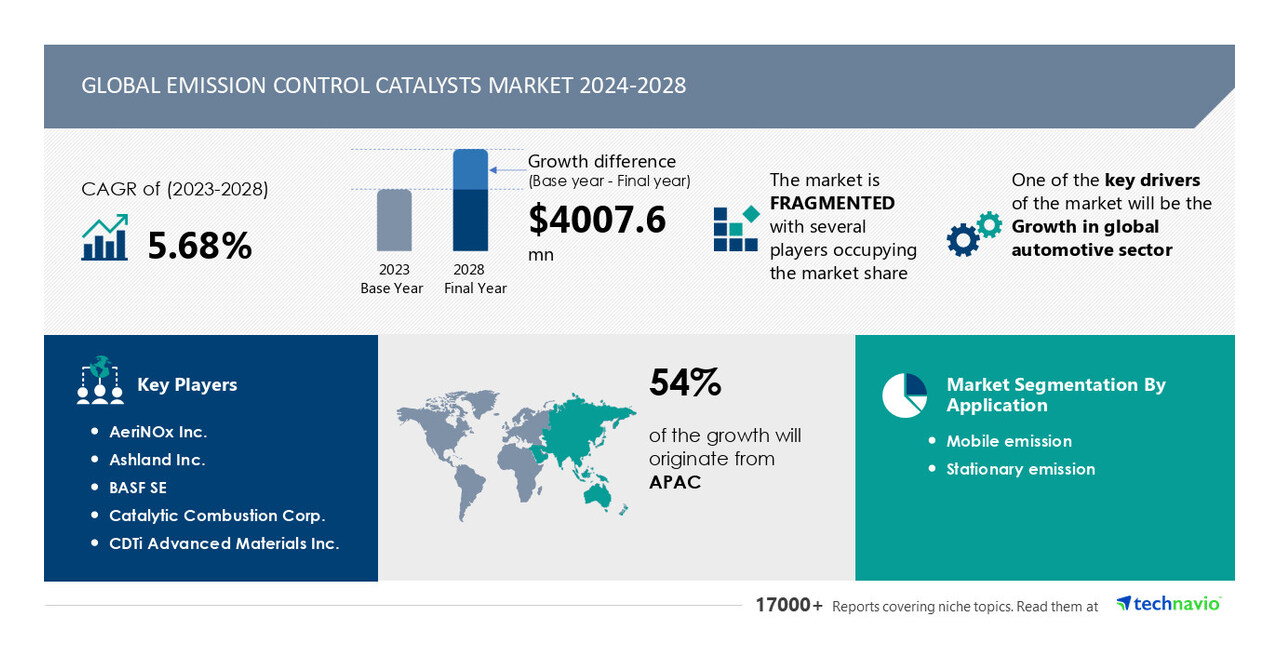
AI-Driven Market Transformation, Emission Control Catalysts Market to Grow by USD 4.01 Billion (2024-2028) Boosted by Global Automotive Sector - Technavio Report
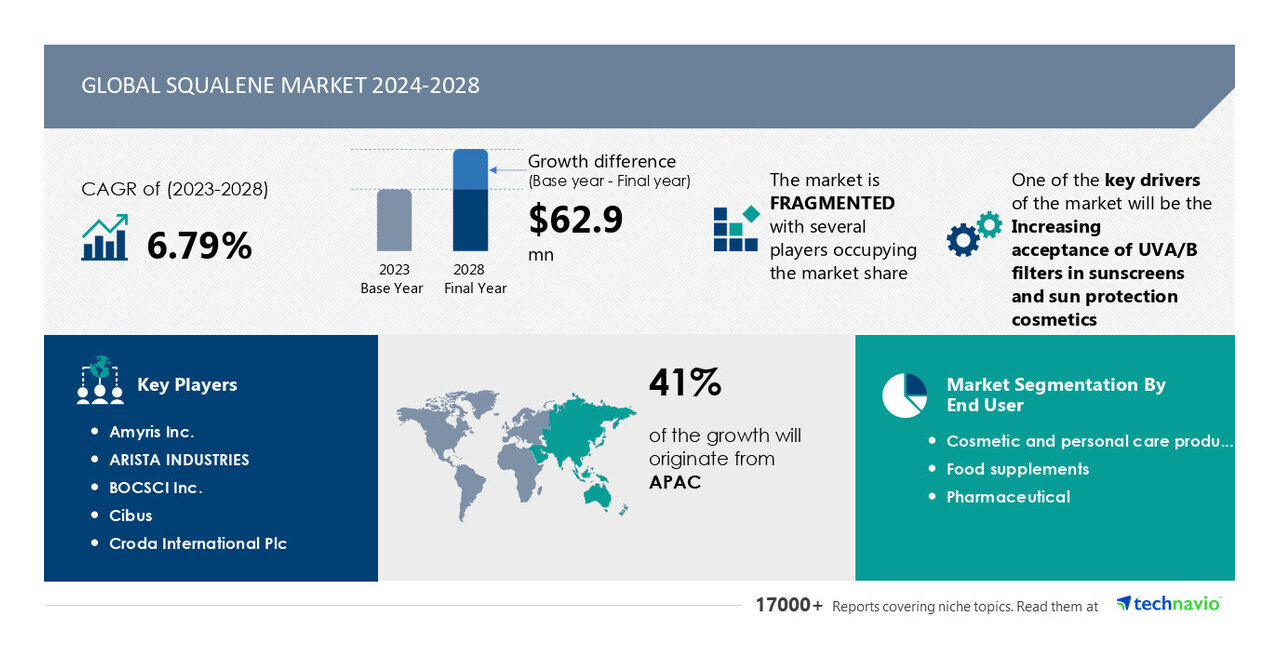
Squalene Market to Grow by USD 62.9 Million from 2024-2028, Driven by Rising Adoption of UVA/UVB Filters in Sunscreens, Report Powered by AI - Technavio
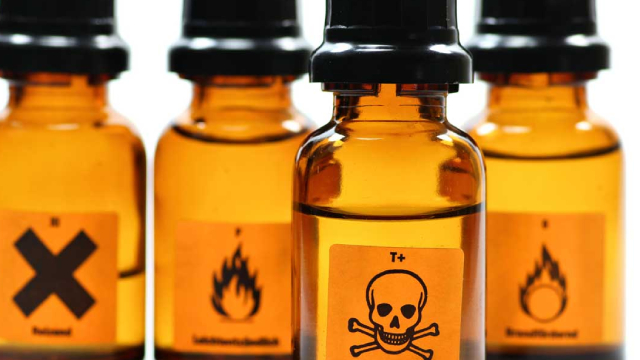
Evonik - I Continue To Be Long Here
Evonik: Another Exit In A Low Margin Division
Evonik says recovery unlikely in 2024, plans 2,000 job cuts
Evonik: The Reversal Could Be Significant, 'Buy'

Evonik Industries AG (EVKIF) Q3 2023 Earnings Conference Call Transcript

Evonik Industries AG (EVKIF) Q2 2023 Earnings Call Transcript
Source: https://incomestatements.info
Category: Stock Reports
