See more : Environmental Impact Acquisition Corp. (ENVIU) Income Statement Analysis – Financial Results
Complete financial analysis of Evotec SE (EVO) income statement, including revenue, profit margins, EPS and key performance metrics. Get detailed insights into the financial performance of Evotec SE, a leading company in the Drug Manufacturers – Specialty & Generic industry within the Healthcare sector.
- BHP Group Limited (BBL) Income Statement Analysis – Financial Results
- Bionoid Pharma Inc. (BINP) Income Statement Analysis – Financial Results
- Tuscan Holdings Corp. II (THCA) Income Statement Analysis – Financial Results
- Reliance Home Finance Limited (RELHOME.BO) Income Statement Analysis – Financial Results
- Mitsui Mining & Smelting Co., Ltd. (5706.T) Income Statement Analysis – Financial Results
Evotec SE (EVO)
About Evotec SE
Evotec SE operates as drug discovery and development partner for the pharmaceutical and biotechnology industry worldwide. The company is developing pharmaceutical products in various therapeutic areas, such as diabetes and complications of diabetes, fibrosis, infectious diseases, CNS diseases, oncology, pain and inflammation, immunology, rare diseases, respiratory diseases, and women's health. It has collaboration agreements with Bayer AG; Lilly; Chinook Therapeutics; Novo Nordisk A/S; Galapagos; Pfizer Inc.; CONBA Pharmaceutical Co., Ltd.; Bristol Myers Squibb Company; Zhejiang JingXin Pharmaceutical Co., Ltd; Kazia Therapeutics; Apeiron Biologics; and Takeda Pharmaceuticals. The company was formerly known as Evotec AG and changed its name to Evotec SE in April 2019. Evotec SE was incorporated in 1993 and is headquartered in Hamburg, Germany.
| Metric | 2023 | 2022 | 2021 | 2020 | 2019 | 2018 | 2017 | 2016 | 2015 | 2014 | 2013 | 2012 | 2011 | 2010 | 2009 | 2008 | 2007 | 2006 | 2005 | 2004 | 2003 | 2002 | 2001 |
|---|---|---|---|---|---|---|---|---|---|---|---|---|---|---|---|---|---|---|---|---|---|---|---|
| Revenue | 781.43M | 751.45M | 618.03M | 500.92M | 446.44M | 375.41M | 257.63M | 164.51M | 127.68M | 89.50M | 85.94M | 87.27M | 80.13M | 55.26M | 42.68M | 39.61M | 32.89M | 67.35M | 64.12M | 1.94M | 3.57M | 0.00 | 0.00 |
| Cost of Revenue | 606.38M | 577.38M | 466.49M | 375.18M | 313.55M | 263.39M | 175.06M | 105.95M | 89.69M | 60.12M | 54.72M | 56.24M | 45.14M | 30.92M | 24.26M | 21.98M | 24.86M | 44.40M | 42.99M | 0.00 | 0.00 | 0.00 | 0.00 |
| Gross Profit | 175.05M | 174.07M | 151.54M | 125.74M | 132.89M | 112.02M | 82.57M | 58.55M | 37.99M | 29.38M | 31.22M | 31.02M | 34.99M | 24.35M | 18.42M | 17.64M | 8.02M | 22.95M | 21.13M | 1.94M | 3.57M | 0.00 | 0.00 |
| Gross Profit Ratio | 22.40% | 23.16% | 24.52% | 25.10% | 29.77% | 29.84% | 32.05% | 35.59% | 29.75% | 32.83% | 36.33% | 35.55% | 43.66% | 44.06% | 43.16% | 44.52% | 24.40% | 34.08% | 32.95% | 100.00% | 100.00% | 0.00% | 0.00% |
| Research & Development | 57.52M | 76.64M | 72.20M | 63.95M | 58.43M | 35.62M | 17.61M | 18.11M | 18.34M | 12.40M | 9.66M | 8.34M | 8.44M | 6.12M | 20.95M | 42.54M | 36.94M | 30.31M | 9.30M | 0.00 | 0.00 | 0.00 | 0.00 |
| General & Administrative | 152.74M | 142.70M | 96.02M | 77.24M | 66.55M | 57.01M | 42.38M | 27.01M | 25.17M | 17.99M | 16.60M | 16.30M | 15.76M | 15.96M | 16.70M | 19.95M | 17.81M | 18.58M | 15.54M | 0.00 | 0.00 | 0.00 | 0.00 |
| Selling & Marketing | 16.87M | 13.49M | 9.42M | 9.50M | 9.09M | 0.00 | 0.00 | 0.00 | 0.00 | 0.00 | 0.00 | 0.00 | 0.00 | 0.00 | 0.00 | 0.00 | 0.00 | 0.00 | 0.00 | 0.00 | 0.00 | 0.00 | 0.00 |
| SG&A | 169.61M | 156.19M | 105.45M | 77.24M | 66.55M | 57.01M | 42.38M | 27.01M | 25.17M | 17.99M | 16.60M | 16.30M | 15.76M | 15.96M | 16.70M | 19.95M | 17.81M | 18.58M | 15.54M | 6.10M | 5.27M | 5.02M | 4.27M |
| Other Expenses | -4.57M | -79.62M | -67.78M | -67.21M | -66.60M | 257.00K | -209.00K | 4.00K | 263.00K | 39.00K | 16.00K | 171.00K | 1.49M | 1.80M | -3.29M | -11.87M | 149.00K | 274.00K | 614.00K | -38.30M | -41.99M | -28.93M | -17.01M |
| Operating Expenses | 222.56M | 153.22M | 109.86M | 73.98M | 58.38M | 49.22M | 43.89M | 21.81M | 40.52M | 27.24M | 27.05M | 30.72M | 30.65M | 27.17M | 38.03M | 63.13M | 57.24M | 53.75M | 36.26M | -32.20M | -36.72M | -23.91M | -12.74M |
| Cost & Expenses | 828.93M | 730.60M | 576.36M | 449.16M | 371.92M | 312.61M | 218.96M | 127.76M | 130.21M | 87.35M | 81.77M | 86.96M | 75.79M | 58.08M | 62.30M | 85.11M | 82.10M | 98.15M | 79.25M | -32.20M | -36.72M | -23.91M | -12.74M |
| Interest Income | 9.26M | 8.34M | 2.27M | 1.34M | 2.23M | 898.00K | 903.00K | 863.00K | 533.00K | 469.00K | 261.00K | 655.00K | 413.00K | 241.00K | 499.00K | 2.96M | 1.96M | 1.37M | 851.00K | 0.00 | 0.00 | 0.00 | 0.00 |
| Interest Expense | 11.74M | 13.15M | 9.25M | 8.47M | 7.46M | 2.59M | 1.26M | 1.52M | 1.73M | 1.62M | 1.87M | 1.86M | 1.86M | 866.00K | 433.00K | 839.00K | 483.00K | 671.00K | 698.00K | 0.00 | 0.00 | 0.00 | 0.00 |
| Depreciation & Amortization | 92.98M | 81.66M | 67.61M | 56.06M | 48.81M | 31.29M | 20.77M | 11.89M | 11.94M | 8.54M | 9.17M | 8.82M | 6.61M | 5.51M | 4.78M | 5.13M | 8.94M | 9.61M | 16.40M | 2.14M | 2.03M | 0.00 | 0.00 |
| EBITDA | 24.13M | -86.08M | 298.41M | 75.50M | 86.77M | 105.88M | 35.50M | 45.57M | 24.93M | 5.00M | -14.07M | 4.51M | 13.90M | 9.49M | -39.61M | -70.01M | -36.08M | -22.15M | -18.44M | -67.56M | -31.12M | -23.91M | -12.74M |
| EBITDA Ratio | 3.09% | 12.53% | 15.36% | 19.76% | 27.25% | 25.25% | 22.65% | 29.87% | 7.99% | 12.50% | 15.84% | 11.40% | 17.82% | 16.76% | -40.03% | -125.03% | -109.71% | -29.29% | -0.94% | -1,452.23% | -870.96% | 0.00% | 0.00% |
| Operating Income | -47.51M | 12.50M | 27.32M | 48.52M | 62.59M | 77.46M | 37.50M | 31.34M | 11.64M | -6.38M | -21.35M | -3.20M | 5.21M | 1.72M | -42.30M | -73.21M | -58.12M | -36.76M | -32.97M | -30.26M | -33.15M | -23.91M | -12.74M |
| Operating Income Ratio | -6.08% | 1.66% | 4.42% | 9.69% | 14.02% | 20.63% | 14.55% | 19.05% | 9.12% | -7.13% | -24.84% | -3.67% | 6.50% | 3.10% | -99.10% | -184.81% | -176.72% | -54.58% | -51.42% | -1,562.82% | -927.80% | 0.00% | 0.00% |
| Total Other Income/Expenses | -33.09M | -174.81M | 195.98M | -22.72M | -6.03M | -5.46M | -11.16M | 1.61M | 851.00K | 1.22M | -2.30M | -6.55M | 49.00K | 2.15M | -21.16M | -28.20M | 1.37M | -1.46M | -20.40M | 0.00 | 0.00 | 0.00 | 0.00 |
| Income Before Tax | -80.59M | -153.96M | 236.98M | 25.81M | 56.56M | 72.00M | 26.33M | 32.95M | 12.49M | -5.16M | -23.65M | -5.01M | 5.26M | 3.87M | -44.82M | -75.97M | -54.41M | -35.98M | -35.53M | 0.00 | 0.00 | 0.00 | 0.00 |
| Income Before Tax Ratio | -10.31% | -20.49% | 38.34% | 5.15% | 12.67% | 19.18% | 10.22% | 20.03% | 9.78% | -5.76% | -27.52% | -5.75% | 6.56% | 7.00% | -105.00% | -191.78% | -165.44% | -53.41% | -55.42% | 0.00% | 0.00% | 0.00% | 0.00% |
| Income Tax Expense | 3.32M | 21.70M | 21.47M | 19.56M | 19.33M | -12.06M | 2.33M | 6.11M | -4.03M | 1.82M | 1.79M | -7.49M | -1.40M | 882.00K | 678.00K | 2.32M | -6.35M | 320.00K | -4.53M | -798.91K | 96.08K | 23.90M | 12.77M |
| Net Income | -83.91M | -175.66M | 215.51M | 6.28M | 38.16M | 84.17M | 24.26M | 27.53M | 16.52M | -6.98M | -25.43M | 2.48M | 6.75M | 3.26M | -45.50M | -78.29M | -11.16M | -32.47M | -33.58M | -29.46M | -33.25M | -23.90M | -12.77M |
| Net Income Ratio | -10.74% | -23.38% | 34.87% | 1.25% | 8.55% | 22.42% | 9.42% | 16.73% | 12.94% | -7.80% | -29.59% | 2.84% | 8.42% | 5.90% | -106.59% | -197.63% | -33.92% | -48.21% | -52.38% | -1,521.56% | -930.49% | 0.00% | 0.00% |
| EPS | -0.47 | -0.99 | 1.30 | 0.04 | 0.25 | 0.57 | 0.16 | 0.20 | 0.13 | -0.05 | -0.21 | 0.02 | 0.06 | 0.03 | -0.43 | -0.82 | -0.16 | -0.49 | -0.65 | -1.36 | -37.01 | -39.97 | -40.78 |
| EPS Diluted | -0.47 | -0.99 | 1.30 | 0.04 | 0.25 | 0.57 | 0.16 | 0.20 | 0.12 | -0.05 | -0.21 | 0.02 | 0.06 | 0.03 | -0.43 | -0.82 | -0.16 | -0.49 | -0.65 | -1.36 | -37.01 | -39.97 | -40.78 |
| Weighted Avg Shares Out | 176.92M | 176.67M | 166.41M | 153.75M | 149.73M | 147.48M | 145.01M | 132.51M | 131.68M | 131.29M | 121.22M | 117.30M | 116.02M | 109.01M | 106.85M | 95.20M | 71.83M | 66.36M | 51.99M | 21.71M | 898.27K | 597.93K | 313.09K |
| Weighted Avg Shares Out (Dil) | 176.92M | 176.70M | 166.41M | 153.75M | 149.73M | 147.48M | 145.01M | 132.51M | 137.63M | 131.29M | 121.22M | 117.30M | 116.02M | 109.01M | 106.85M | 95.20M | 71.83M | 66.36M | 51.99M | 21.71M | 898.27K | 597.93K | 313.09K |

Evotec and Bristol Myers Squibb Enter Licence Agreement within Neuroscience Partnership

AnalytixInsight Reports First Quarter 2023 Financial Results and MarketWall Strongest Quarter

Intel Makes Technology More Accessible for People with Hearing Loss

TurnOnGreen Expands North American EV Charging Network Across Multiple Hotel Properties

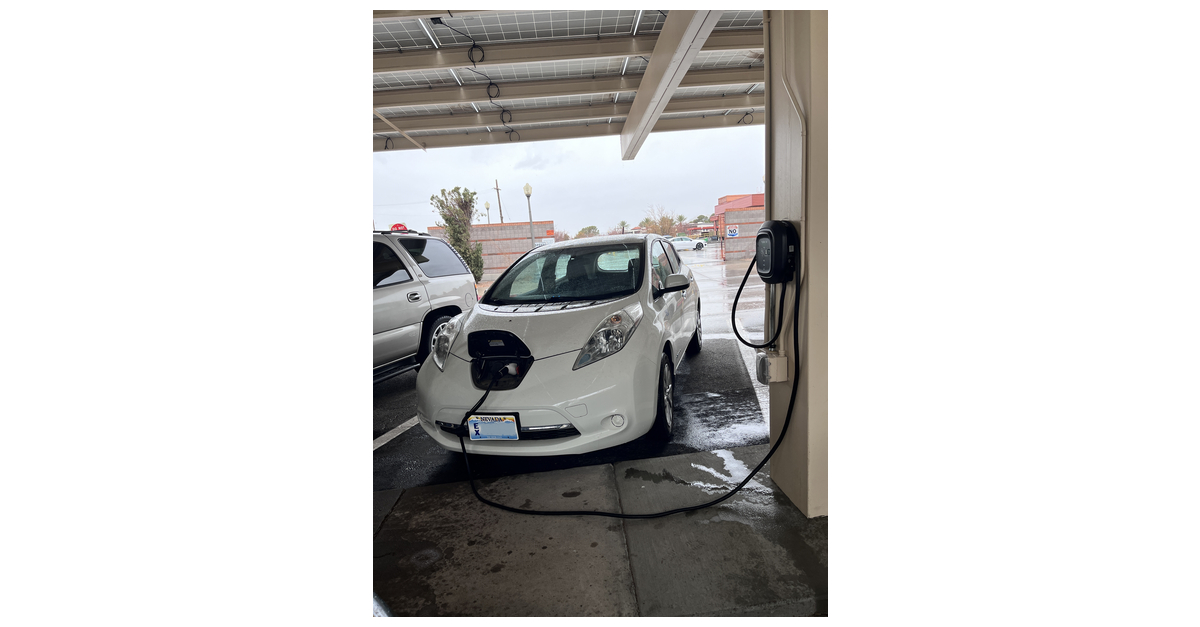
TurnOnGreen Completes Municipal Charging Project in Boulder City, Nevada

Just - Evotec Biologics Launches Tech Partnership for Biosimilars Development and Commercial Manufacturing

EVO ICL Sponsors Jonas Brothers’ The Tour

STAAR Surgical Reports First Quarter 2023 Results

ProAmpac offre des solutions d'emballage durable de pointe et un leadership éclairé au salon Interpack 2023

ProAmpac bringt hochmoderne nachhaltige Verpackungslösungen und Vordenkerrolle auf die Interpack 2023
Source: https://incomestatements.info
Category: Stock Reports
